Aligning Taxes With Economic Growth
Updated November 20, 2014
To read this chapter as it appeared in the 2014 book, click here.
EXECUTIVE SUMMARY
The Problem
Understanding the problems with Minnesota’s tax code first requires an understanding of the principles that should guide the state’s tax policy. Sound tax policy should promote three core principles: economic efficiency and growth, equal taxation of equally situated people, and simplicity. These principles generally favor low tax rates levied on a broad tax base.
The basic problem with Minnesota’s tax code is that it fails to follow these principles. Instead of low tax rates, Minnesota’s personal income, sales, and corporate tax rates are among the highest in the nation. The state boasts the 2nd highest state personal income tax rate on the bottom bracket, 4th highest personal income tax rate on the top bracket, 7th highest sales tax rate, and 3rd highest corporate income tax rate. These high tax rates are levied on a narrow base, certainly a narrower base than if Minnesota followed sound tax policy principles.
High tax rates coupled with a narrow tax base damage Minnesota’s economy as taxpayers change their behavior. The state’s high tax rates discourage work, discourage investment in education and on the job training, discourage entrepreneurial risk-taking, encourage rearranging the timing of financial transactions, encourage politically favored and less productive investments, and increase the cost of raising revenue.
A tax system with low tax rates and a broad tax base minimizes these economic distortions. With minimal distortions, economic decisions allocate resources to their most productive use. Economists agree this increases the total size of the economic pie. In the simplest terms, the obvious damage then from Minnesota’s high tax rates is a smaller economic pie for the entire economy.
Corporate income taxes are particularly harmful to economic growth because they create a high amount of economic damage for each dollar of revenue collected. Thus, the problems with the corporate income tax are more than just high rates on a narrow base. As one economist recently put it, the corporate income tax is “self-defeating.”
High tax rates negatively impact Minnesotans across the income spectrum. The “effective marginal tax rate” is a technical term for “the percentage of an additional dollar of earnings that is unavailable to a worker because it is paid in taxes or offset by reductions in benefits from government programs.” A single parent with two children making around $20,000 can be subject to an effective marginal tax rate of 87 percent. A Minnesota C-Corp can be subject to a 60 percent marginal effective tax rate.
What Needs to be Done
In the near term, Minnesota will likely continue to be a state that collects more revenue than average. Though not optimal, this does not mean Minnesota can’t dramatically improve its tax system to better promote economic growth and prosperity. Minnesota can offer below average tax rates to families and businesses by the end of the decade by adopting the following recommendations structured around three important themes: Lowering rates and broadening bases, increasing transparency, and reducing complexity.
Lower Rates and Broaden Base to Reward Work and Investment
- Set long-term goals to reduce tax rates and aim to reach them by the end of the decade.
- Create an optional, lower income tax rate based on federal Adjusted Gross Income in 2015.
- Eliminate the corporate income tax in 2016.
- Eliminate the statewide general tax on business and seasonal property after the corporate income tax is fully eliminated.
- Eliminate the estate tax, phased over six years.
- Review and sunset all tax preferences for their effectiveness versus lower tax rates
Increase the Transparency of Minnesota’s Tax System
- Include Federal Taxes in the Minnesota Tax Incidence Study
- Analyze the complex interactions between Minnesota and federal tax and public welfare programs.
Reduce the Complexity of Minnesota’s Tax System
- Replace the Capital Equipment Sales Tax Refund with An Upfront Exemption
- Reduce the Number of Property Tax Classifications and Tiers from 51 to 4
- Eliminate Minnesota’s High “Advertised” Property Tax Rates.
THE PROBLEM
Sound tax policy should promote economic efficiency and growth, equal taxation of equally situated people, and simplicity. These principles generally favor low tax rates levied on a broad tax base. Minnesota’s tax code falls woefully short of this ideal. The tax code’s many credits, deductions, exemptions and exclusions substantially narrow the tax base. As a result of this narrow base and high expenditures, tax rates in Minnesota are among the highest in the nation. These high rates unnecessarily distort and damage Minnesota’s economy.
This report focuses mainly on structural problems with Minnesota’s tax system. To the extent Minnesota’s damaging high tax rates are caused by high spending, the level of government expenditures is addressed by recommendations offered in the companion Minnesota Policy Blueprint report, Smart Budgeting for an Era of Limits.
Principles of Sound Tax Policy
Understanding the problems with Minnesota’s tax code first requires an understanding of the principles that should guide the state’s tax policy. The basic problem with Minnesota’s tax code is that it fails to follow these principles.
While there is often strong disagreement over specific tax policies, there is generally broad agreement on certain principles that should guide tax policy. In a recent Minnesota Department of Revenue report, authored by an ideologically diverse group of economists (including this author), identified three guiding principles of sound tax policy: “efficiency, equal treatment of equals, and simplicity.” Here is how the report describes each principle.
Economic efficiency. “Allocating economic resources toward their most productive use is perhaps the chief advantage of free markets. This allocative efficiency is, in effect, a way of making the economic pie as large as possible. One goal of a successful tax system is to interfere as little as possible with this process. A mark of effective tax policy, therefore, is the preservation of incentives for individuals and businesses to make decisions on the basis of productivity rather than for pure tax benefit.”
Equal treatment of equals. “Under this principle, those with equal incomes should pay equal income taxes regardless of the source of their income, for example. Similarly, taxpayers with equal consumption should pay equal consumption tax no matter what items they buy. Violating this standard gives taxpayers incentives to seek low-taxed sources of income (or buy untaxed products) for tax rather than economic reasons.”
Simplicity. “The simpler the system, the more easily taxpayers can comply with it. A simple tax system is also easy to administer and enforce, thus preserving public resources. A simpler tax system is also likely to be more transparent to voters and their elected representatives.”1
These principles recognize the negative impact taxes can have on economic growth and economic decision making. Taxes first damage the economy by adding a cost, or financial burden to whatever activity is being taxed. Taxes also damage the economy by distorting economic decisions. “Essentially all taxes distort decisions,” according to University of Minnesota Economist V.V. Chari.2 And basing economic decisions on taxes versus productivity damages the economy. Economists call this damage the excess burden of taxation.
As economists Alex Brill and Alan Viard explain, the excess burden “measures the extent to which a tax interferes with the taxpayer’s freedom to choose his or her preferred behavior. Popular discussions of tax policy often focus on the obvious burden of taxation: the amount of taxes people pay. But excess burden arises when behavior changes in a way that causes taxes to not be paid.”3
Based on these principles, it is clear that an effective tax system will minimize distortions to maximize economic growth.
Guiding Principles Favor Low Tax Rates Levied on a Broad Tax Base
What does an effective tax system look like?
The three guiding principles strongly favor a tax system with low tax rates levied on a broad tax base. That’s the conclusion of the report published by the Minnesota Department of Revenue and the “canonical goal” of sound tax policy.4 It’s easy to understand why.
Low tax rates and a broad tax base offer few avenues for taxpayers to avoid the tax
by changing behavior. Lower rates promote economic efficiency by minimizing decisions to reduce or forgo the taxed activity. A broad base promotes both efficiency and equal treatment of equals by minimizing opportunities to opt for lower- or non- taxed alternatives. A broad base also promotes simplicity by minimizing the complex assortment of loopholes inherent in a narrow base.
Minnesota’s Tax System Fails to Follow Sound Tax Policy Principles
Minnesota’s tax system falls woefully short of being ideal or effective. While the three guiding principles favor low tax rates and a broad tax base, Minnesota’s tax system generally imposes high tax rates on unnecessarily narrow tax bases. In fact, Minnesota’s personal income, sales, and corporate tax rates are among the highest in the nation. The following state tax rate rankings for Minnesota tell the story.
- 2nd highest personal income tax rate on the bottom bracket of earners. 5
- 4th highest personal income tax rate on top bracket of earners.6
- 2nd highest personal income tax rate on a household earning $250,000 in taxable income.7
- 7th highest state sales tax rate.8
- 3rd highest corporate income tax rate.9
- 2nd highest estate tax rate, though Minnesota shares this rank with nine other states.10
Minnesota’s 9.85 percent top personal income tax rate is 85 percent higher than the national average.11 The combined state and federal corporate income tax rate is 41.4 percent in Minnesota. Because the federal income tax rate is already the highest in the industrialized world, this combined rate would be the third-highest in the industrialized world if states were considered as countries. Also, consider that a C-corporation doing business only in Minnesota has a 60 percent marginal tax rate taking into account the double taxation of dividends after entity level taxes are paid first (see Figure 4).
These high tax rates are levied on a narrow base, certainly a narrower base than if Minnesota were to follow sound tax policy principles. The most recent tax expenditure analysis identified $1.85 billion in sales to Minnesota consumers that are exempt from the Minnesota sales and use tax in FY 2014.12 Compared to actual collections of $5.04 billion in FY 2014, these exemptions narrow the sales tax base.13 Personal income tax exclusions, deductions, subtractions, and credits add up to $5.57 billion for FY 2014, compared to $9.65 billion in actual collections.14
Defenders of the state’s current tax rates argue Minnesota fares a little better when you compare actual tax collections. However, the fact that Minnesota’s state rankings on actual tax collections are not quite as high as its rankings on tax rates actually reflects Minnesota’s narrow statutory tax base and the negative effects of high tax rates on the economy and Minnesota’s tax base.
While Minnesota’s general sales tax rate ranks 7th, general state sales tax collections as a percent of personal income rank 20th and general sales tax collections per capita rank 18th. A part of this difference is explained by Minnesota exempting motor vehicle sales from the general sales tax and, instead, taxing motor vehicle sales under the motor vehicle sales tax. But much of the explanation for this difference is that Minnesota’s 7th highest state sales tax rate applies to a relatively narrower base of goods and services.15 A high rate on a smaller base simply doesn’t collect as much revenue.
Recent research by economist John Mikesell confirms Minnesota’s sales tax is levied on a narrower base than most states. Using newly available state-level personal consumption data, Mikesell compares state sales tax “C-efficiency”—the “collection gap” between actual state sales tax collections and what would be collected if states uniformly taxed all consumption.16 In 2007, Minnesota’s sales tax C-efficiency ranked 32nd of the 45 states with a general sales taxes. Furthermore, this research shows Minnesota’s sales tax base narrowed more than most states from 1998 to 2007. During this decade, the C-efficiency of Minnesota’s sales tax dropped 17%, which was the seventh largest percentage loss.
Though not as dramatic, corporate income and personal income tax collections also rank a touch lower than their corresponding tax rate rankings.17
Minnesota’s combination of high rates and narrow bases is consistent with what occurs in states with similarly high rates. Economists at George Mason University find high state sales tax rates are linked to the number of tax base narrowing sales tax exemptions available in a state.18 The authors conclude, “High tax rates increase the incentive to lobby for special exemptions.”
High Tax Rates Coupled with a Narrow Tax Base Damage Minnesota’s Economy
As explained above, a tax system with low tax rates and a broad tax base minimizes economic distortions. With minimal distortions, economic decisions allocate resources to their most productive uses. Economists agree this increases the total size of the economic pie. Thus, in the simplest terms, the obvious damage from Minnesota’s high tax rates is a smaller economic pie for the entire economy.
More technically, as the tax rate increases there are two interrelated negative effects on the economy. First, the amount of taxed economic activity is reduced as the tax rate increases. People decide to work less, consume less, and invest less. Second, the average value of each unit of the lost economic activity increases as the tax rate increases. As MIT economist James Poterba explains, these two negative effects combine so that the economic damage from each incremental increase in the tax rate tends “to rise with the square of the tax rate, so that as the tax rate gets into higher and higher territory, the marginal dead-weight losses tend to grow rapidly.”19 A 60 percent marginal tax rate is not three times more damaging to the economy than a 20 percent tax rate, but about nine times more harmful at the margin.
The economic damage from taxes is also higher when there are more alternatives for taxpayers to reduce their tax liabilities. The excess burden of taxation is larger when the behavioral response to taxes is greater. Opportunities to engage in the same economic activity outside of Minnesota make the Minnesota tax base more responsive to tax rates than the federal tax base.
Center of the American Experiment’s report, Minnesotans on the Move, suggests people are responding to Minnesota’s high tax rates by either leaving or avoiding the state. The income and migration data analyzed in the report shows Minnesota tends to “receive people and income from higher tax states and contribute people and income to lower tax states.”20
In addition to decisions on where to live, economists have documented many ways that high tax rates create distortions that damage our economy.21
- Discourage work. The Journal of Economic Literature documents the economically important negative effect of tax rates on labor supply.22 Moreover, women’s labor supply generally is more responsive to taxes than men’s labor supply.
- Discourage investment in education and on-the-job training. The tax code punishes successful education and training by lowering the returns to investments in human capital. When you tax something you get less of it. Our tax code provides a deterrent to investments in education and training by taxing the returns to successful education and training that push taxpayers into higher tax brackets.
- Encourage rearranging the timing of financial transactions. High income tax rates provide a strong incentive to time taxable transactions to occur in years with lower tax rates and to rearrange financial and accounting transactions to engage in the maximum legal tax avoidance. Income taxes also provide a strong incentive to take compensation in tax preferred forms such as perks, exotic business trips, and tax-exempt benefits.
- Encourage politically favored and less productive investments. High tax
rates distort investment decisions away from the most productive investments for growth toward politically favored, tax-preferred, investments that are less productive. The Minnesota tax code provides a strong incentive to invest in lower-risk, tax free investments, such as tax exempt municipal bonds or Treasury bills, instead of taxable equity in high-risk startups. - Reduce the rewards to entrepreneurial risk-taking. Entrepreneurs work less and invest less in job creating ventures under high tax rates. In a study of the effect of the federal 1986 tax reform on sole proprietors’ hiring and wage-setting decisions published in the Journal of Labor Economics, economists found that “individual income taxes exert a substantial influence on the probability that an entrepreneur hires workers.”23 Moreover, the same economists find that “lower taxes also raise the total wage payments to those workers.”
- Increase the cost of raising revenue. There is a cost to the private sector economy of raising another dollar of tax revenue. This cost is higher when tax rates are higher and when the tax base is more responsive to tax rates. The federal Office of Management and Budget (OMB) has stated during the Clinton, Bush, and Obama administrations that, “because taxes generally distort relative prices, they impose a burden in excess of the revenues they raise. Recent studies of the U.S. tax system suggest a range of values for the marginal excess burden, of which a reasonable estimate is 25 cents per dollar of revenue.” This means that each dollar of revenue collected for the federal government costs the private sector $1.25. This is the sum of the dollar transferred from the private sector to the public sector and the 25 cents of lost economic activity created by distorting decisions to make people less productive. At the current combined federal plus Minnesota income-tax rates, each extra dollar of government spending is likely to cost the private sector around $1.25 to $3.00.24
The Economic Damage from Corporate Income Tax Rates
Minnesota’s combined state and federal statutory rate (41.1 percent) is the 3rd-highest corporate tax rate in the industrialized world. It is 62 percent higher than the average tax rate among Organisation for Economic Co-operation and Development (OECD) members of 25.3 percent.25
Corporate income taxes are particularly harmful to economic growth because they create a high amount of economic damage for each dollar of revenue collected.26 The 2009 Minnesota Governor’s 21st Century Tax Reform Commission concluded Minnesota’s corporate income tax penalizes “success and stifles capital formation while discouraging savings, investment, new jobs and economic growth. Competitive, growth and policy problems are endemic to the inefficient, regressive and economically harmful corporate income tax.”27
The Congressional Budget Office (CBO) notes, “The domestic distortions that the corporate income tax induces are large compared with the revenues that the tax generates.” 28
Boston College economist Laurence Kotlikoff recently offered a similar perspective in the New York Times: “I, like many economists, suspect that our corporate income tax is economically self-defeating — hurting workers, not capitalists, and collecting precious little revenue to boot.”29 Note the emphasis on workers. Kotlikoff points out how corporations can move their operations and jobs to avoid taxation. Workers do not have the same flexibility.
Thus, the problems with the corporate income tax are more than just high rates on a narrow base. The corporate income tax is inherently a bad and economically damaging tax. The cost of what is given up in economic growth is just too high compared to the relatively small tax revenue collected.
Economists Robert Chirinko and Daniel Wilson estimate the damage Minnesota’s corporate income tax inflicts on the economy. Specifically, they estimate the change in investment and state product for each state in the long-run in response to changes in state business tax policy in their 2010 article published in the Federal Reserve Bank of San Francisco Economic Review.30 Chirinko and Wilson’s model estimates that repealing the Minnesota corporate income tax would result in a long-run increase in real Minnesota State Output (GDP) of about 5 percent and an increase in equipment and structures capital stock in Minnesota of around 10 percent. The net long run effect would be an increase in Minnesota output (GDP) of over three percent after netting out the reduction in the growth of state spending or the economic effects of base broadening to finance the repeal of the economically harmful Minnesota corporate income tax.
High Tax Rates Negatively Affect Minnesotans across the Income Spectrum
The “effective marginal tax rate” is a technical term for “the percentage of an additional dollar of earnings that is unavailable to a worker because it is paid in taxes or offset by reductions in benefits from government programs.”31 It is a measure of the bite that both taxes and benefit losses take out of one’s paycheck when one works a little more.
The rich are not the only people who can face high effective marginal tax rate. Figures 1 to 4 present four examples of how current laws create high effective marginal tax rates on Minnesotans.
- First, consider a single parent with two children making $18,720, whose hourly income rises from $9 per hour to $10. Figure 1 shows this family would have an effective marginal tax rate of 87 percent on this additional income. Of the $2,080 in additional income, this family would get to keep only $263. The government effectively takes $1,817 that was produced by the hard work of this single parent. Most of this loss is due to the phase-outs of the MFIP program that “claws back” benefits as the family’s pretax income rises. 32 The rest of the effective marginal tax is due to income and payroll taxes. This high rate reveals the need to consider the structure of the tax code in combination with the structure of the state’s public benefits.
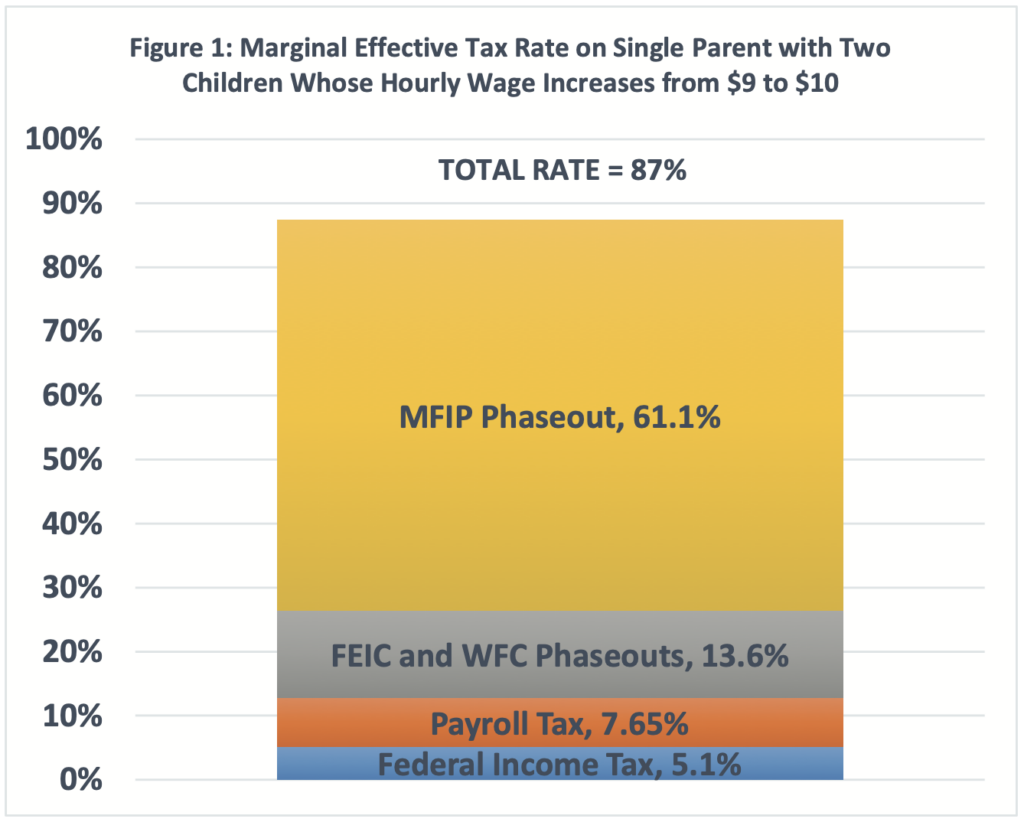
Source: Nina Manzi and Joel Michael, The Federal Earned Income Tax Credit and The Minnesota Working Family Credit, Minnesota House of Representatives (March 2013), available at http://www. house.leg.state.mn.us/hrd/pubs/feicwfc.pdf; and National Bureau of Economic Research, Internet TAXSIM Version 9.2 With ATRA, at http://users.nber.org/~taxsim/taxsim-calc9/index.html.
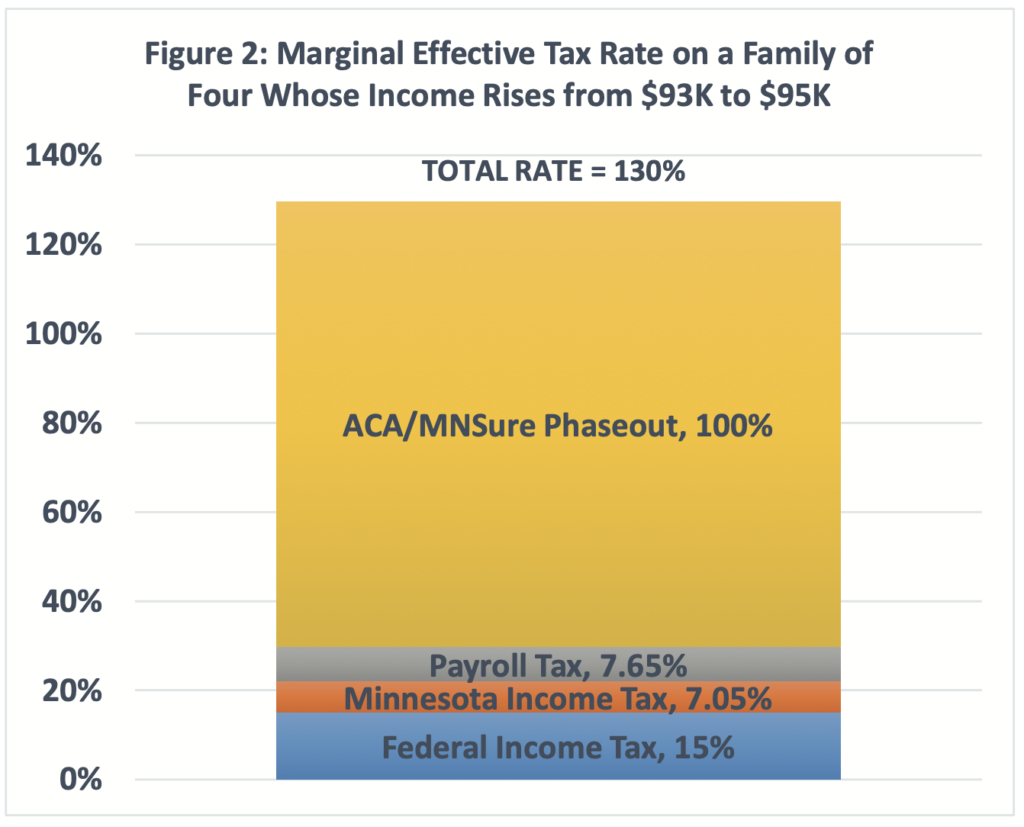
Source: Kaiser Family Foundation, Subsidy Calculator, at http://kff. org/interactive/subsidy-calculator/.
- Second, consider a family of four earning $93,000 that is enrolled in MNsure (Figure 2). When this family earns another $2000 in pre-tax income, the family’s take-home income actually falls by $600 because of the combined effect of the family’s 7.05 percent Minnesota income tax bracket, 15% federal income tax bracket, 7.65 percent federal FICA payroll tax and the phase-out of the MNsure tax credits set by the Affordable Care Act (ACA). This family faces an effective marginal tax rate of 130%.
- Third, consider a small business owner, such as a small day care provider, married to a high income earning spouse, such as a doctor (Figure 3). This taxpayer faces a 57 percent marginal income tax rate from the combination of the 9.85 percent Minnesota income tax, 35 percent federal income tax, and 15.3 percent federal FICA payroll tax.33
- Finally, there is a 60 percent effective tax rate on the income earned by the Minnesota owners of a C-corporation doing business entirely within Minnesota and paying annual dividends (Figure 4). This is the result of the double taxation of C-corporation income. Minnesota imposes a 9.8 percent corporate income tax on top of the federal corporate income tax of 35 percent. Then dividends are subject to a 9.85 percent Minnesota and 23.8% federal dividend tax. 34
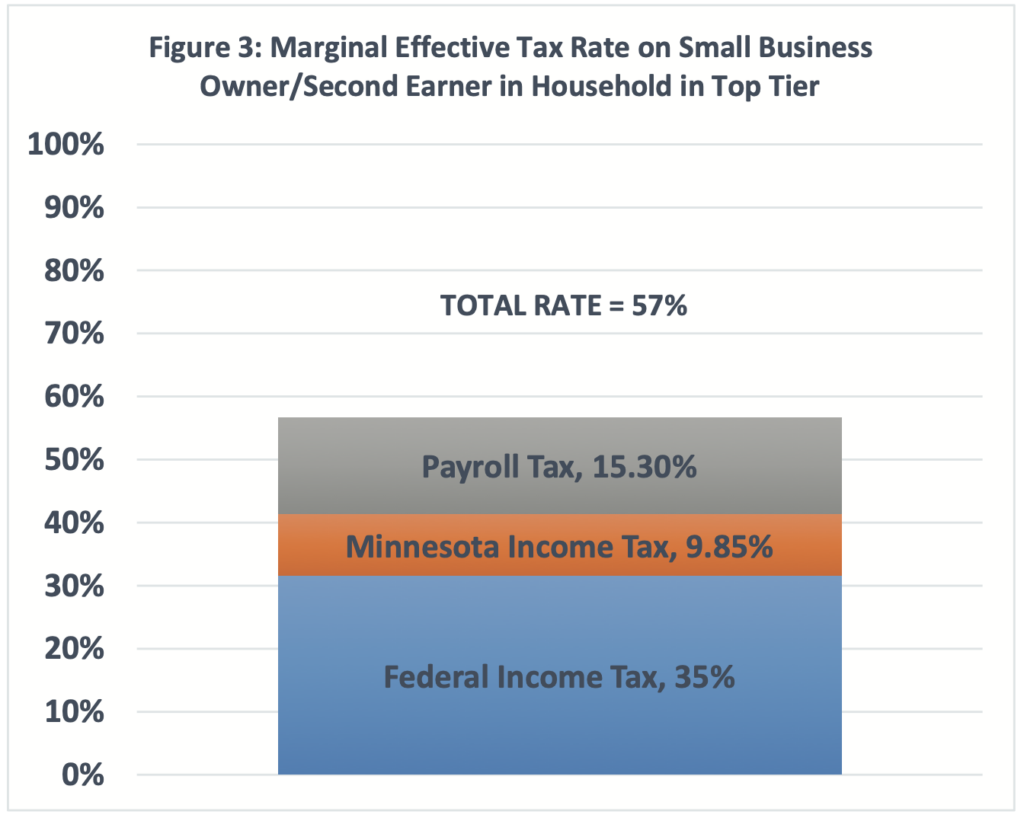
Note: Rates reported in the bar graph are statutory rates and do not add up to the total marginal effective tax rate due to the interaction of the federal deductibility of state taxes.
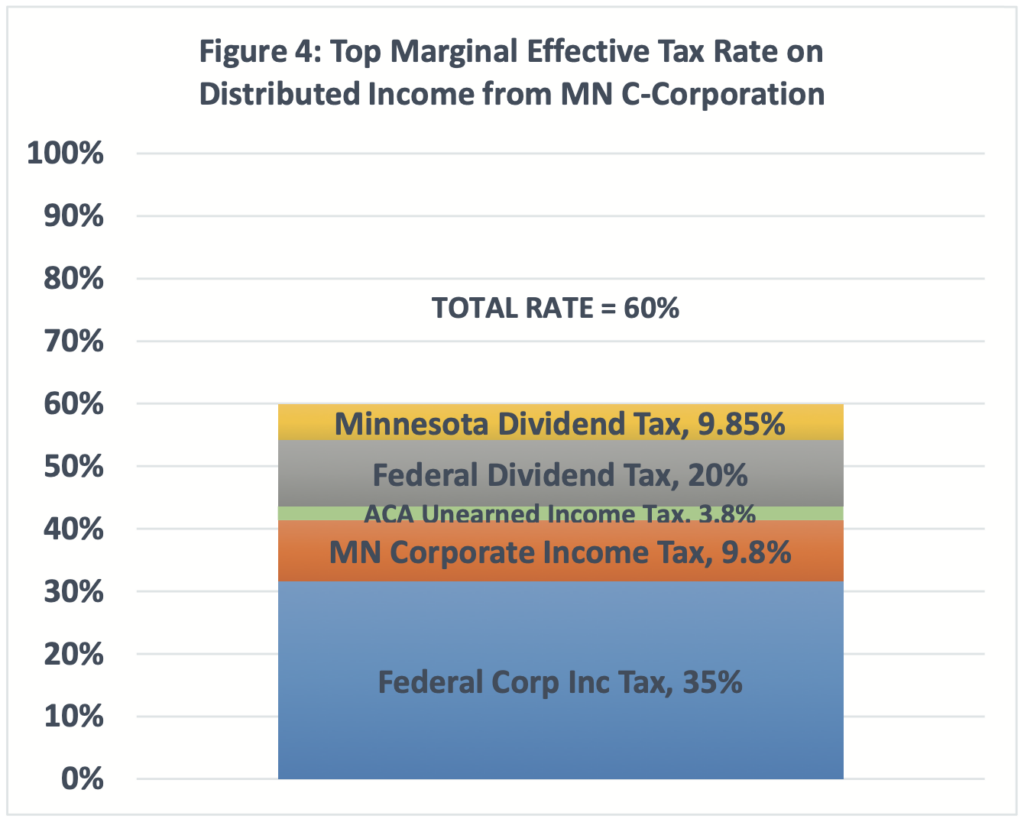
Note: Rates reported in the bar graph are statutory rates and do not add up to the total marginal effective tax rate due to the interaction of the federal deductibility of state taxes and the fact that dividend taxes apply only to the profits remaining after corporate income taxes are collected.
Whenever a taxpayer faces an effective marginal tax rate over 50 percent there is a greater benefit to the taxpayer to shelter another dollar from taxation than to be more productive to earn another dollar. High marginal tax rates create a disincentive to earn by reducing the rewards for work. Over time, these high effective tax rates harm our culture by undermining the virtue of hard work.
WHAT NEEDS TO BE DONE
In the near term, Minnesota will likely continue to be a state that collects more than average revenue. Though not optimal, this does not mean Minnesota can’t dramatically improve its tax system to better promote economic growth and prosperity. As detailed above, economists agree levying low tax rates on a broad tax base represents the ideal tax system. It minimizes economic distortions, which maximizes economic growth. Minnesota can make a strong move toward this ideal while continuing to collect above average tax revenue.
By itself, a broader base can bring in the revenue necessary to pay for lower rates. However, the economic growth spurred by minimizing distortions will also increase the tax base, allowing for even lower rates. Further helping matters, a growing economy and rising incomes will create space for lower spending and, therefore, lower tax rates by reducing the number of people who rely on the social safety net.
Center of the American Experiment also proposed spending restraint and budget reforms in a companion set of Blueprint recommendations on the state budget. Combining this spending restraint with sound tax reforms focused on growing the economy will allow Minnesota’s above average tax collections to migrate closer to average and allow for even lower, more competitive tax rates.
Minnesota can offer below average tax rates to families and businesses by the end of the decade by adopting the following recommendations structured around three important themes: Lowering rates and broadening bases, reducing complexity and increasing transparency.
Lower Rates and Broaden Base to Reward Work and Investment
Recommendation 1: Set long-term goals.
Minnesota cannot lower tax rates and broaden tax bases to ideal levels over night. The immediate loss in revenue to the state from lowering tax rates to the ideal level would be too great. Also, certain changes to the tax base will create winners and losers. Broadening the base will deliver lower rates to people already paying the tax, but will increase taxes on people subject to the expanded base. Any movement to broaden the base will likely need to be gradual or include strategic offsets to minimize immediate and painful losses.
Because a move to lower rates and a broader base must be gradual, the state should start by setting long-term goals for the rate reductions the state intends to achieve. Setting goals will create the framework for identifying and implementing strategies to achieve lower rates and broader base. This will give the state the best chance to figure out how to bring along all the special interests who understandably don’t prioritize the overall health of the state’s economy above all else. It will also give the state the motivation to stay the course when barriers seem insurmountable.
Specifically, Minnesota should set the following long-term goals and aim to reach them by the end of the decade:
- 5 percent income tax rate
- 5 percent sales tax rate
- Eliminate the corporate income tax
- Eliminate the statewide general tax on business and seasonal property
- Eliminate the estate tax rate
Recommendation 2: Create an optional, lower income tax rate based on federal Adjusted Gross Income in 2015.
To begin the gradual move toward lower tax rates and a broader tax base, the state should create an optional, lower income tax rate based on federal adjusted gross income (AGI) in 2015. One reason Minnesota income tax rates are so high (2nd highest bottom bracket rate and 4th highest top bracket rate) is because the state uses federal taxable income as the starting point for determining personal income tax liabilities, a narrower income tax base than most states start from. Federal taxable income equals a person’s AGI minus personal exemptions and itemized deductions. Only eight states start from federal taxable income.35 Most states—29 to be exact—start from AGI and thus start by treating federal personal exemptions and itemized deductions as income.
By starting from federal AGI, certain federal itemized deductions, like the home mortgage deduction, might still be allowed as a deduction on state taxes, but would not be automatic. State lawmakers would consciously need to set and justify each deduction in statute. Going through this process would almost certainly reduce the number of itemized deductions and broaden the income tax base. The state would also have the opportunity to reduce or eliminate the personal exemption, which would also broaden the base.
If the base were broadened by starting with AGI, the state could provide the option to take lower tax rate and continue collecting similar revenues. At the very least, this would introduce Minnesotans to what a more sound tax structure would look like.
This idea is modeled after Rhode Island’s alternative flat tax. Between 2006 and 2010, those subject to the top rate were given the option to choose a lower flat rate based on AGI, without any personal exemptions or itemized deductions. By 2010, state lawmakers decided to reduce rates permanently on all earners and start everyone from AGI. In the process the top rate dropped from 9.9 percent to a less distortionary and more competitive rate of 5.99 percent.
In 2009, former Minnesota state Rep. Laura Brod introduced this basic idea and called it the alternative even rate tax. Instead of gradually reducing the rate, she proposed an immediate change to an alternative even rate tax of 6 percent. It is time to reintroduce this idea in 2015 and introduce Minnesota to how applying sound tax policy principles to the income tax can enhance economic growth.
Recommendation 3: Eliminate the corporate income tax in 2016.
Corporate income tax rates should not just be lowered, they should be eliminated. Combined with the federal corporate income tax rate, Minnesota corporations pay stunningly high tax rates. When so many economists agree the tax is self-defeating, it’s time to eliminate it.
This is not a giveaway to the rich. As the Minnesota Department Revenue readily acknowledges in its periodic tax incidence study, the Minnesota corporate income tax is regressive. Of the gain to Minnesota taxpayers, over 90 percent is passed to Minnesota consumers, in the form of higher prices, and workers, in the form of lower wages.36
This is by no means a radical idea. Ideally, business tax revenues should be reduced to match the government benefits businesses receive. The Council On State Taxation (COST) estimates Minnesota businesses received $1 in government benefits for every $3.20 in state and local taxes they paid in FY 2013. Of that $3.20 in state and local business taxes, the corporate income tax and statewide general tax accounted for only $0.55, or 17 percent. Thus, eliminating both taxes would still mean Minnesota businesses would pay far more in taxes than the benefits they receive.
The revenue loss from eliminating the corporate income tax would likely require spending cuts too politically painful to implement immediately. Thus, some phase in would likely be needed.
Recommendation 4: Eliminate the statewide general tax on business and seasonal property after the corporate income tax is fully eliminated.
Minnesota applies a statewide general property tax to business and seasonal recreational property. By law 95 percent of this tax is collected from businesses. This tax violates several principles of sound tax policy. First, it’s a hidden tax because much of the burden falls on consumers and workers who never see a tax bill. The tax therefore violates transparency. Second, it violates equal treatment of equals by subjecting similarly situated property—property with the same value receiving the same public services—to this additional tax. Third, this additional tax reduces economy efficiency by discouraging investment in Minnesota business properties.
Recommendation 5: Eliminate the estate tax, phased in over six years.
Minnesota’s estate tax should be eliminated because it imposes higher economic costs
on Minnesota workers and families than can be justified by the small net increase in Minnesota tax revenue. The Minnesota estate tax is a very high tax ($146,000 paid on average in 2012) levied on a very narrow base (1,141 residents in 2012).37 As such, it poses enormous incentives to distort decisions in economically damaging ways. It discourages savings and investment while promoting tax avoidance.38 It provides strong incentives for estate planning, lifetime transfers, and moving out of Minnesota physically or via the creation of trusts in other states.
Furthermore, on net the estate tax may collect much less revenue than the state reports. Economist Douglas Bernheim writing in the NBER publication Tax Policy and the Economy has noted that the reduction in federal income tax revenue from estate planning transfers may offset gross federal estate tax revenue.39 Bernheim’s work suggests Minnesota’s gross estate tax collections overestimate the net increase in Minnesota total tax revenue by not including the effect of the estate tax in eroding the personal income tax base.
Recommendation 6: Review and sunset all tax preferences for their effectiveness versus lower tax rates.
It’s easy to understand the benefit of lowering tax rates by broadening the state’s sales and income tax bases. Nonetheless, it is politically very hard to do. Changes to the tax base tend to create both winners and losers, and the losers usually put up a strong fight against any change. In order to create an environment more welcome to change, the state needs to institutionalize mechanisms that provide better information on tax preferences and motivate lawmakers to periodically review tax preferences.
Minnesota should fully integrate all tax credits, exemptions, exclusions, and deductions into the biennial budget process, requiring the governor and Legislature to make explicit decisions about whether to extend, repeal, modify or replace them. Each tax preference should be evaluated by a Tax Expenditure Sunset Commission along the lines of the recommendations of the Tax Expenditure Review Report. This commission should examine whether lower tax rates would be better for economic growth than continuing each tax credit, exemption, exclusion, or deduction.
State budget summaries should include total tax expenditures for each tax to show their fiscal impact on gross tax revenue. Tax expenditures should be included as a separate category in the Legislature’s joint budget resolution.
Each tax preference should have a revenue-neutral sunset following its evaluation and recommendation from the Tax Expenditure Sunset Commission to the Governor and the Legislature. Unless the tax expenditure is extended by the sunset date, it would expire and the rate for the tax would be adjusted downward to hold revenue constant.
Applying a sunset to all tax preferences can help motivate lawmakers to eliminate these tax preferences. A sunset would force a conversation on the legitimacy of a tax preference compared to lower tax rates and compels lawmakers to take action to reauthorize the preference.
Increase the Transparency of Minnesota’s Tax System
Recommendation 7: Include federal taxes in the Minnesota Tax Incidence Study.
The biennial Tax Incidence Study currently includes taxes paid to state and local governments in Minnesota while excluding all federal taxes. Excluding the large, progressive federal slice of Minnesotans’ tax payments confuses policymakers and the public. This omission is the source of the erroneous claim that higher income households pay a lower percentage of their income in taxes than lower income households. The Minnesota Department of Revenue has testified that higher income households pay a greater percentage of their income in total taxes than lower income households.40
Because taxpayers pay federal, state, and local taxes they deserve to see transparently the total tax burden from all levels of taxation. Minnesota should include federal taxes along with state and local taxes in the Tax Incidence Study.41
Recommendation 8: Analyze the complex interactions between Minnesota and federal tax and public welfare programs.
The interaction between Minnesota’s tax code, the federal tax code, Minnesota public programs, and federal public programs creates high effective marginal tax rates for too many Minnesotans. A solution that would increase the percentage of the paycheck these Minnesotans brought home starts with measuring the effective marginal income tax rates that create barriers to upward mobility. Once the welfare walls and cliffs from multiple benefit phase-outs and taxes were measured, the programs should be redesigned to accomplish the following:
- Remove the highest cliffs that punish hard work;
- Expand the programs and/or tax credits that are most effective at providing a path to upward mobility;
- Eliminate the programs and/or tax credits that are not effective; and
- Reduce the overall number of programs to reduce complexity.
This analysis should be reported periodically in a study that calculates the effective marginal tax rates on Minnesotans with a variety of incomes, income types, household sizes, and participation in public programs. The study should also describe each of the tax distortions created by Minnesota taxes.
Reduce the Complexity of Minnesota’s Tax System
Recommendation 9: Replace the capital equipment sales tax refund with an upfront exemption.
Minnesota businesses must currently collect sales tax from their employees, customers, and investors every time they buy or lease equipment used for manufacturing, fabricating, mining or refining. Then they have to apply for a refund of this business-to-business (B2B) sales tax. The state refunds about $220 million each year, but the process is cumbersome, and businesses fail to claim about 5 percent of eligible refunds. As the 21st Century Tax Reform Commission points out, “This delay is particularly harmful to small or startup businesses, where cash-flow is a crucial concern. Some businesses hire consultants to track and file for the refund on their behalf, which represents an additional business cost.”42 Furthermore, the state has to administer and audit both the initial collection of this B2B sales tax and the eventual refund of these payments.
This refund process was changed to an upfront exemption in 2013 law. However, 2014 law delayed the effective date for this change from September 1, 2014 to July 1, 2015, which reveals lawmakers are not fully committed to implementing the upfront exemption.
Changing to an up-front sales tax exemption on capital equipment purchases as scheduled in July 2015 would simplify compliance and regulation. An up-front sales tax exemption on capital equipment purchases would also be good tax policy. The Tax Expenditure Review Report says, “Economists and public policy analysts generally think of the sales tax as a consumption tax. As such, it should be levied only on sales to consumers, and not on sales between businesses. Taxing intermediate purchases— including capital equipment, office supplies, and building materials—will cause tax pyramiding as one business passes the tax cost along to the next. Ultimately, this creates an additional (and hidden) tax burden on consumers who purchase the final goods and products.”
Recommendation 10: Reduce the Number of Property Tax Classifications and Tiers from 51 to 4.
Minnesota currently categorizes property into 51 different classes and tiers for taxation. This introduces an astounding amount of needless complexity for both taxpayers and government officials. Minnesota should adopt the recommendation of the 21st Century Tax Reform Commission to consolidate classes with similar uses and rates under four broad classes.
- Agricultural;
- Residential (including residential rental property);
- Low-value commercial and industrial; and
- High-value commercial and industrial.
Consolidating classes will inevitably lead to some property paying higher taxes and others paying less. To minimize the size of these changes in tax liabilities, the 21st Century Tax Reform Commission recommends making sure “no class has a significant change in class rate. For example, the various residential classes currently have class rates that range from 0.75% to 1.25%; they could all be combined into a single residential class rate of 1%.”43
Recommendation 11: Eliminate Minnesota’s high “advertised” property tax rates.
Another 21st Century Tax Reform Commission recommendation the state should adopt is to eliminate Minnesota’s high advertised property tax rates. Minnesota local property taxing jurisdictions report incredibly high “total local tax rates.” For instance, St. Paul reports local property tax rates exceeding 160 percent.44 Here’s how the Commission explains the problem.
Since 1988, Minnesota’s property tax system has been unique among the states in that the taxable portion of property valuations is calculated using relatively low “classification rates” (1% or 2%, for example). These low classification rates effectively shrink local property tax bases (by 98% or 99%, for example).
These dramatic base reductions drive local property tax rates to the uncommonly high levels needed to meet local revenue goals. The current statewide average local property tax rate (or “tax capacity rate,” in the current system) is 94.7%.
To potential investors in other parts of the nation or world, our unique system is likely to appear unnecessarily complex, and our tax rates confiscatory. On paper, Minnesota’s rates are many times higher than those of other states even though actual property tax burdens may be comparable.45
Minnesota should abandon the current tax capacity system and convert to lower mill rates based on the actual value of the property.
John A. Spry is an associate professor in the Finance Department at the University of St. Thomas. He earned his B.S. in economics at Ohio State University, and his M.A. and Ph.D. in economics at the University of Rochester. His work as a consultant includes a report on the economics and taxation of riverboat casinos for the Indiana Legislature and he co-authored the Minnesota Tax Expenditure Review Report for the Minnesota Department of Revenue. He was a member of the Minnesota Governor’s 21st Century Tax Reform Commission.
ENDNOTES
1 Note these principles can contradict themselves and other policy goals. As the report notes, treating equals equally can require a more complex tax when business arrangements are complex. Thus, these are indeed guides and not hard and fast rules.
2 V. V. Chari, Tax Reform: Lesson from Economic Theory [PowerPoint slides] (n.d.), available at http://hhei.umn.edu/assets/ppt/CHARI.ppt.
3 Alex M. Brill and Alan D. Viard, The Real Tax Burden: More than Dollars and Cents, (Washington D.C.: AEI Press, 2011): p. 4. This section is influ- enced by Brill and Viard’s excellent exposition of tax policy and excess bur- den.
4 Jason Furman, The Concept of Neutrality in Tax Policy, U.S. Senate Committee on Finance Hearing on “Tax: Fundamentals in Advance of Re- form, April 15, 2008, available at http://www.brookings.edu/research/testi- mony/2008/04/15-tax-neutrality-furman.
5 Data is available from Federation of Tax Administrators, at http://www. taxadmin.org/fta/rate/xls/ind_inc.xls.
6 Data is available from Federation of Tax Administrators, at http://www. taxadmin.org/fta/rate/xls/ind_inc.xls.
7 See Editorial, “Minnesota: Reckoning with restraint,” Pioneer Press, May 31, 2014, available at http://www.twincities.com/opinion/ci_25868817/min- nesota-reckoning-restraint-pioneer-press-editorial; and Lyman Stone, “State Personal Income Tax Rates and Brackets 2014 Update,” Tax Foundation Fiscal Fact No. 22, March 21, 2014, available at http://taxfoundation.org/article/ state-personal-income-tax-rates-and-brackets-2014-update. This is because California and Hawaii’s top income bracket starts at a higher income levels than Minnesota.
8 Federation of Tax Administrators, State Sales Tax Rates and Food & Drug Exemptions (As of January 1, 2014) (January 2014), available at http://www. taxadmin.org/fta/rate/sales.pdf.
9 Federation of Tax Administrators, Range of State Corporate Income Tax Rates (For tax year 2014 – as of January 1, 2014) (February 2014), available at http://www.taxadmin.org/fta/rate/corp_inc.pdf.
10 Joel Michael, Survey of State Estate, Inheritance, and Gift Taxes (Min- nesota House of Representatives, December 2013), available at http://www. house.leg.state.mn.us/hrd/pubs/estatesurv.pdf; and Joel Michael, The Minne- sota Estate Tax (Minnesota House of Representatives, July 2014), available at http://www.house.leg.state.mn.us/hrd/pubs/ss/ssesttx.pdf.
11 Data is available from Federation of Tax Administrators, at http://www. taxadmin.org/fta/rate/xls/ind_inc.xls.
12 Minnesota Department of Revenue, 2014 Tax Expenditure Summary List (February 2014), available at http://www.revenue.state.mn.us/research_stats/ Pages/Tax_Expenditure_Reports.aspx.
13 Minnesota Management and Budget, Revenue and Economic Update (July 2014), available at http://mn.gov/mmb/images/Revenue%2526Econom- ic_Update_July2014.pdf.
14 Id.; and Minnesota Department of Revenue, 2014 Tax Expenditure Summary List (February 2014), available at http://www.revenue.state.mn.us/ research_stats/Pages/Tax_Expenditure_Reports.aspx.
15 Buying fewer goods and services could also be part of the explanation, but Minnesotans do not appear to be stingier than the average American. Minnesotans spend about average based on personal consumption expendi- tures as a percent of personal income. In 2012, personal consumption expen- ditures in Minnesota was 80.8 percent of personal income, slightly higher than the national average of 79.1 percent. Author calculations based on Bureau of Economic Analysis, Personal Consumption Expenditures by State, 1997-2012 (Prototype Estimates) (August 7, 2014), available at http://www.bea. gov/newsreleases/regional/pce/pce_newsrelease.htm; and Bureau of Econom- ic Analysis, Annual State Personal Income and Employment data, available at http://www.bea.gov/regional/index.htm.
16 John Mikesell, “State retail sales tax productivity: identifying economic, legal, and administrative influences on c-efficiency ratios across the American States,” in Proceedings: Forum for Economists International, Conference held in Amsterdam, May 30-June 2, 2014, ed. M. Peter van der Hoek (Papendrecht, Netherlands: Forum for Economists International, 2014). In comparing states, Mikesell adjusts for major variations in the structure of state sales taxes, such as whether or not motor vehicle sales are included in the general sales tax.
17 Compared to the 3rd highest corporate tax rate, Minnesota collects the 6th most corporate income taxes as a percent of personal income and the 8th most per capita. Compared to personal income tax brackets that range from the 2nd to 4th highest, Minnesota collects the 5th most personal income taxes both as a percent of personal income and on a per capita basis.
18 Andreea Militaru and Thomas Stratmann, “A Survey of Sales Tax Ex- emptions in the States: Understanding Sales Taxes and Sales Tax Exemptions,” Mercatus Center Working Paper #14-01 (January 2014), available at http:// mercatus.org/sites/default/files/Stratmann_SalesTaxExemptions_for-release. pdf.
19 Douglas Clement, ed., “Interview with James Poterba,” The Region, June 1, 2008, available at https://www.minneapolisfed.org/publications_papers/ pub_display.cfm?id=3478&.
20 Peter J. Nelson, Minnesotans on the Move to Lower Tax States (Center of the American Experiment, April 2013), available at http://www.american- experiment.org/sites/default/files/article_pdf/MN%20Income%20Migration. pdf.
21 Martin Feldstein, “Effects of Taxes on Economic Behavior,” National Tax Journal, Vol. LXI, No. 1 (March 2008), available at http://ntj.tax.org/wwtax- %5Cntjrec.nsf/A6D34F3F901369588525742E006EA140/$FILE/Article%20 06-Feldstein.pdf.
22 Michael Keane and Richard Rogerson, “Micro and Macro Labor Supply Elasticities: A Reassessment of Conventional Wisdom,” Journal of Economic Literature, Vol. 50, No. 2 (June 2012).
23 Robert Carroll et al, “Income Taxes and Entrepreneurs’ Use of Labor,” Journal of Labor Economics, Vol. 18, No. 2 (1999), available at http://www. nber.org/papers/w6578.
24 This estimate is imprecise because the excess burden from standard economic formulas varies across taxpayers facing different effective marginal income tax rates and there is a range of estimated behavioral responses in the economic literature. Minnesota’s tax rates bases are more responsive to taxes than federal tax bases. Minnesotans face higher tax rates than the tax rates used for the OMB’s estimate of the excess burden of federal taxation.
25 The Organization for Economic Co-operation and Development (OECD), OECD Tax Database, Table II.1 –Corporate income tax rates: basic/ non-targeted, available at http://www.oecd.org/tax/tax-policy/tax-database. htm#C_CorporateCaptial.
26 Asa Johansson et al, “Tax and Economic Growth,” Economics Department Working Paper #620, (Organization for Economic Co-operation and Development, July 11, 2008): pp. 2, available at http://www.oecd.org/tax/ tax-policy/41000592.pdf.
27 Minnesota Governor’s 21st Century Tax Reform Commission, Minne- sota’s Millennium: Launching a New Generation of Competitive Leadership and Economic Growth (February 2009): p. 16, available at http://archive.leg.state. mn.us/docs/2009/other/090277.pdf.
28 The CBO goes on to identify at least six ways the corporate income tax rate “has the potential to distort economic incentives and generate inefficiency”:
First, because it is imposed on income from capital, it biases individuals’ decisions about how much to save and can therefore influence overall capital investment and economic growth. Second, because the corporate income tax is imposed only on some kinds of business profits (in the United States, typically those of corporations that have many shareholders) and not on others (such as the profits of partnerships and sole proprietorships), it affects the ways in which businesses are organized and creates biases in investment and production toward those types of business structures that are not subject to the corporate income tax. Third, it creates a bias in corporate financing toward the use of debt—because the tax is imposed on income from equity-financed investment and not on the return to debt-financed investment. Fourth, because the law treats a corporation as a separate taxable entity from which shareholders subsequently realize income in the form of either dividends or capital gains, the relatively beneficial tax treatment of capital gains under the individual income tax creates a bias toward them and against the payment of dividends. Fifth, because the United States levies corporate income tax on the basis of schedules for depreciation that do not correspond to economic depreciation, it taxes different kinds of assets and industries at different effective rates, creating a bias in investment and production toward the more lightly taxed assets and sectors. Finally, the corporate income tax may distort the allocation of resources by making corporations’ compliance with taxation costly and by creating additional opportunities for tax planning.
Congressional Budget Office, Corporate Income Tax Rates: International Comparisons (November 2005): pp. ix, 1, and 2, available at http://www.cbo. gov/sites/default/files/cbofiles/ftpdocs/69xx/doc6902/11-28-corporatetax.pdf.
29 Laurence J. Kotlikoff, “Abolish the Corporate Income Tax,” The New York Times, January 5, 2014, available at http://www.nytimes.com/2014/01/06/ opinion/abolish-the-corporate-income-tax.html.
30 Chirinko, Robert S. and Daniel J. Wilson, “State Business Taxes and Investment: State-by-State Simulations,” Federal Reserve Bank of San Francisco Economic Review (2010), available at http://www.frbsf.org/publications/eco- nomics/review/2010/er13-28.pdf. This paper has an internet modeling applet available at http://www.frbsf.org/csip/taxapp.php.
31 Congressional Budget Office, Effective Marginal Tax Rates for Low- and Moderate-Income Workers (November 15, 2012), available at http://www.cbo. gov/publication/43709.
32 This example is not the only case in which the combination of our tax code and phase-outs of government programs creates high effective marginal tax rates. A study by the non-partisan Minnesota Center for Fiscal Excellence (MCFE), Disincentives to Earn, available at http://www.fiscalexcellence.org/ our-studies/disincentives-to-earn-final.pdf, provides another example. Con- sider a single parent of two children who works more to increase gross family income from $33,000 to $34,000. The effective marginal tax rate from the federal and state earned-income tax credit phase-outs are about 21 percent and 10.3 percent, respectively. These rates reduce the family’s tax credits—in effect, its income—by about $210 and $103. In addition, benefits from the Basic Sliding Fee child-care program are reduced by $1,692 because of the sliding fee. Thus, the reward for earning an additional $1,000 in gross wages is a reduction in take-home family income of $1,005 because of the combined effects of these three programs. A Minnesota House Research study, sum- mary available at http://www.taxadmin.org/fta/meet/06re_data/pres/Wilson_ low-income.pdf, found that—given the intersection of our tax system with various social programs—the average effective marginal tax rate for a single parent with two children and income between $23,500 and $41,700 was 104 percent. On average, working overtime to earn an additional $1,000 in gross income reduces household after-tax income by $40.
33 This 56.7 percent total effective marginal tax rate is less than the sum of all of these individual taxes because of federal deducibility of state taxes.
34 This 60 percent total effective marginal tax rate is less than the sum of all of these individual taxes because of federal deducibility of state taxes and dividend taxes applying to only to C-corporation income after corporate level Minnesota and federal taxes are paid.
35 Federation of Tax Administrators, State Personal Income Taxes: Federal Starting Points (February 2014), available at http://www.taxadmin.org/fta/ rate/stg_pts.pdf.
36 Minnesota Department of Revenue, 2013 Minnesota Tax Incidence Study (March 2013), available at http://www.revenue.state.mn.us/research_stats/re- search_reports/2013/2013_tax_incidence_study_links.pdf.
37 Minnesota Department of Revenue, Minnesota Estate Tax Study (March 5, 2014), available at http://www.revenue.state.mn.us/research_stats/research_ reports/2014/estate_tax_report_3_5_14.pdf.
38 Wojciech Kopczuk, “Estate Taxation,” NBER Reporter: Research Summa- ry (Spring 2006), available at http://www.nber.org/reporter/spring06/kopczuk. html.
39 B. Douglas Bernheim, “Does the Estate Tax Raise Revenue,” in Lawrence H. Summers, ed., Tax Policy and the Economy, Volume 1 (MIT Press 1987), available at http://www.nber.org/chapters/c10931.
40 John LaPlante and Kim Crockett, “The rich pay a lesser percentage of income in taxes? That’s a myth,” Star Tribune, August 7, 2011, available at http://www.startribune.com/opinion/commentaries/126863123.html.
41 The Star Tribune editorial board endorse this idea. Editorial, “State tax bill: Tardy and a bit untidy,” Star Tribune, February 19, 2013, available at http://www.startribune.com/opinion/editorials/191927951.html.
42 Minnesota Governor’s 21st Century Tax Reform Commission, Min- nesota’s Millennium: Launching a New Generation of Competitive Leadership and Economic Growth (2009): p. 20, available at http://archive.leg.state.mn.us/ docs/2009/other/090277.pdf.
43 Id., at p. 21.
44 Ramsey County, Payable 2014 Final Tax Rates, available at http://www. co.ramsey.mn.us/prr/TaxRateCalc.htm.
45 Minnesota Governor’s 21st Century Tax Reform Commission, Min- nesota’s Millennium: Launching a New Generation of Competitive Leadership and Economic Growth (2009): p. 21, available at http://archive.leg.state.mn.us/ docs/2009/other/090277.pdf.