How have the Twin Cities been doing economically?
“Minneapolis population boom echoes Roaring Twenties” the Star Tribune announced in May. “Residents continue to pour into Minneapolis, which is seeing its biggest decade for growth since the 1920s”, it noted, reporting that “Latest estimates from the Metropolitan Council show the city has grown by about 10 percent since just 2010, adding about 37,374 residents. That puts the city’s population, now about 419,000, on pace to reach nearly 450,000 by the end of the decade.”
But not everything is growing at such historic rates. In February, Forbes published its list of America’s fastest growing cities for 2017. They were
- Cape Coral-Fort Myers, Florida
- Orlando-Kissimmee-Sanford, Florida
- Provo-Orem, Utah
- Deltona-Daytona Beach-Ormond Beach, Florida
- Jacksonville, Florida
- North Port-Sarasota-Bradenton, Florida
- Seattle-Tacoma-Bellevue, Washington
- Tampa-St. Petersburg-Clearwater, Florida
- Portland-Vancouver-Hillsboro, Oregon
- Salt Lake City, Utah
- Boise City, Idaho
- Miami-Fort Lauderdale-West Palm Beach, Florida
- Ogden-Clearfield, Utah
- Raleigh, North Carolina
- Palm Bay-Melbourne-Titusville, Florida
- Phoenix-Mesa-Scottsdale, Arizona and Las Vegas-Henderson-Paradise, Nevada
- –
- Lakeland-Winter Haven, Florida
- Charlotte-Concord-Gastonia, North Carolina
- Nashville-Davidson–Murfreesboro–Franklin, Tennessee
No sign of Minneapolis. Why not?
Well, for starters, the 382 Metropolitan Statistical Areas can vary wildly. Some – but not all – of the cities on this list will be feeling the effects of particular local circumstances which are propelling growth. The tech industry in Provo, Utah, and Raleigh, North Carolina, would seem to be good examples.
There’s another reason. The Forbes rankings are based on a number of metrics. Population growth is one. Others are job growth, GDP growth, and wage growth. As well as we might feel Minneapolis is doing in terms of population growth, how well is it doing on these other measures?
The Twin Cities economy, 2010-2015
The Minneapolis-St. Paul-Bloomington metro area has little in common with Provo, Utah. So, lets look at how the local economy has done compared to the 20 Metropolitan Statistical Areas with the highest average GDP between 2010 and 2015.
On job growth, according to data from the Bureau of Economic Analysis, total employment in the Twin Cities increased by 1.8% between 2010 and 2015. This ranked it 16th among the 20 MSAs, as shown in Figure 1.
Figure 1: Percentage change in total employment, 2010-2015
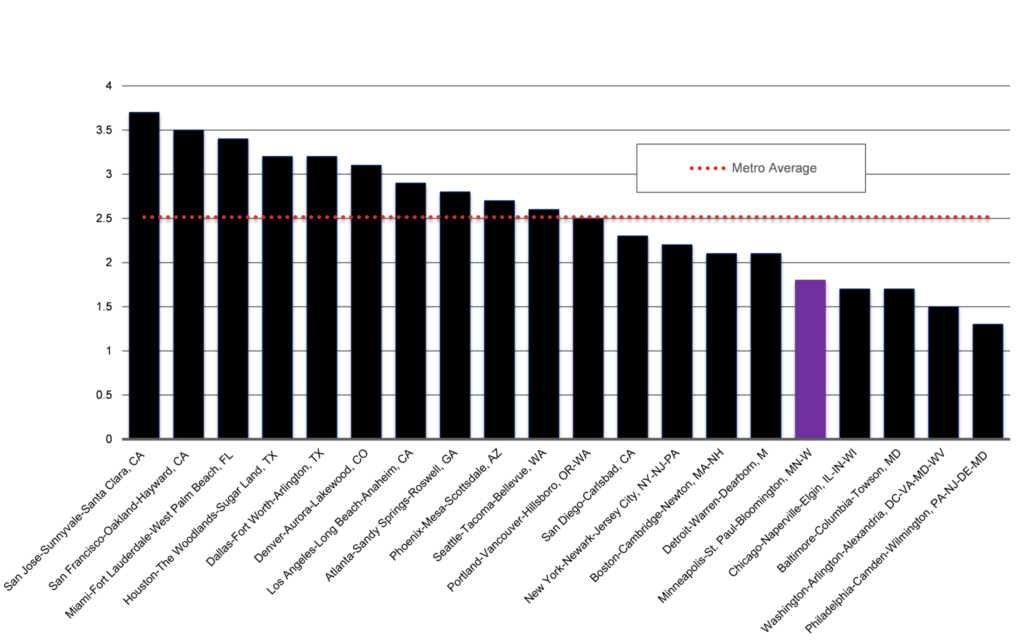
Source: Bureau of Economic Analysis and Center of the American Experiment
On GDP growth, again according to BEA data, real GDP in the Twin Cities increased by 2.5% between 2010 and 2015. This ranked it 9th among the 20 MSAs, as shown in Figure 2.
Figure 2: Percentage change in real GDP, 2010-2015
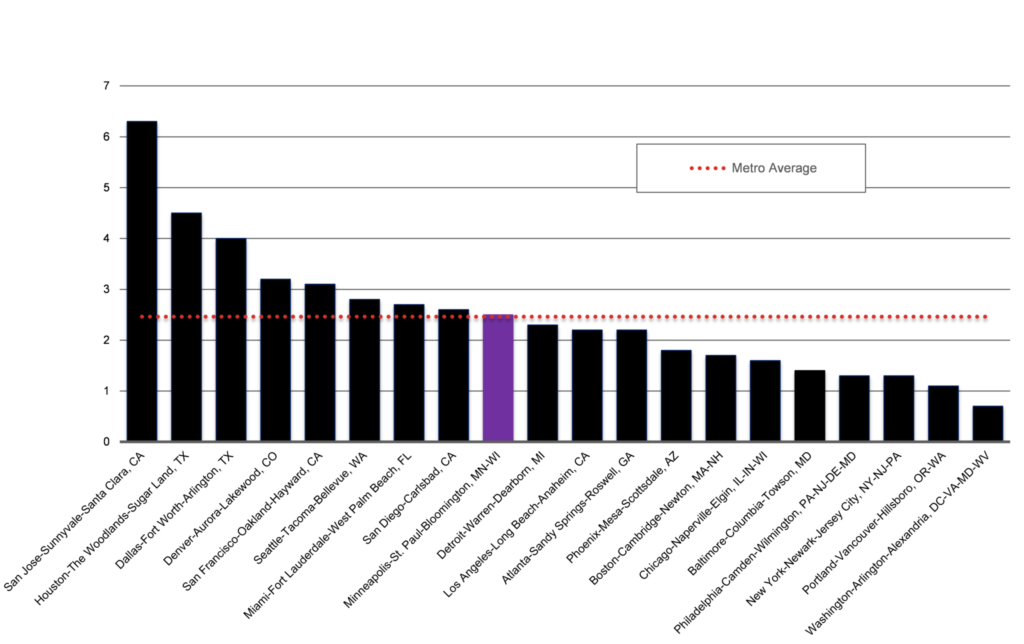
Source: Bureau of Economic Analysis and Center of the American Experiment
On income, real per capita personal income in the Twin Cities increased by 3.9% between 2010 and 2015. This ranked it 11th among the 20 MSAs, as shown in Figure 3.
Figure 3: Percentage change in per capita personal income, 2010-2015
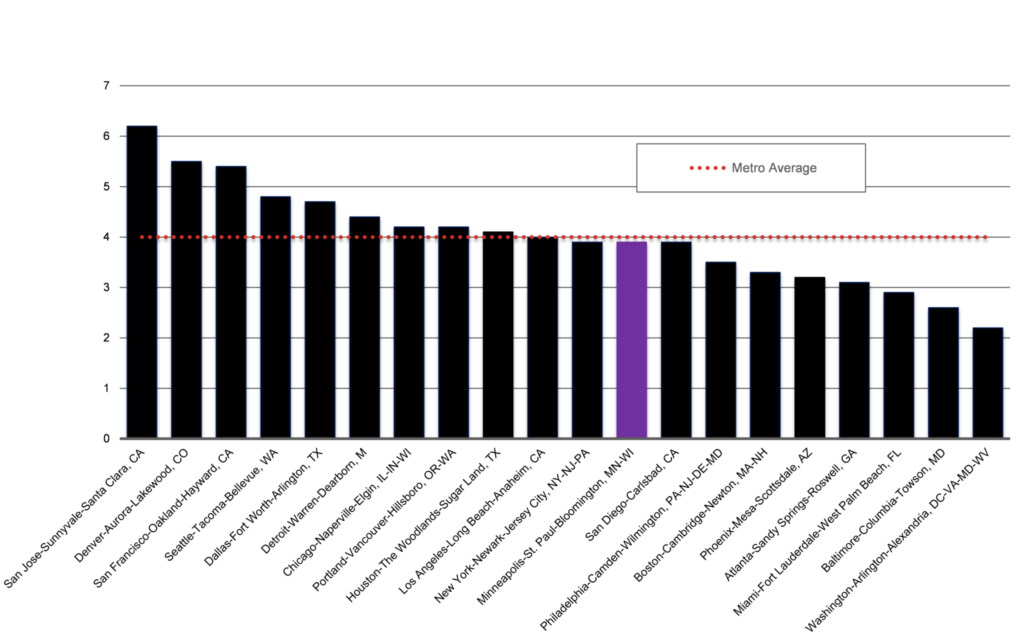
Source: Bureau of Economic Analysis and Center of the American Experiment
And on population growth, the Twin Cities’ population increased by 6% between 2010 and 2016. This ranked it 13th among the 20 MSAs, as shown in Figure 4.
Figure 4: Population growth, 2010-2016
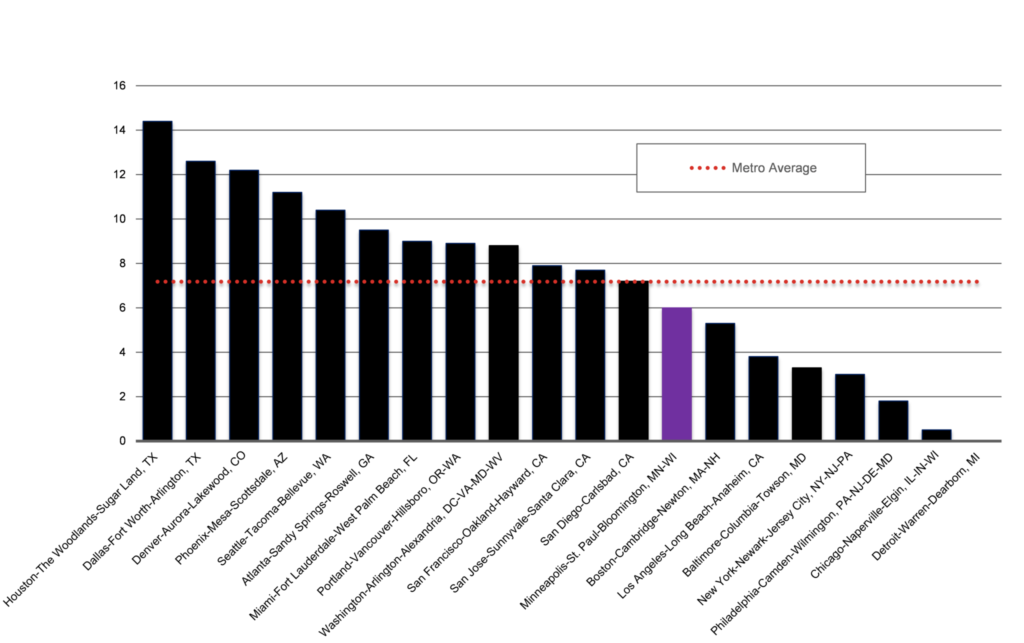
Source: U.S. Census Bureau and Center of the American Experiment
So, compared to its peers, the economy of the Twin Cities is not exactly experiencing a sort of Jazz Age boom. To get a fuller picture, we need to look, not just at one statistic or observation, but at a range of them. Only then can we build up a fuller picture of what is going on in our economy.
John Phelan is an economist at Center of the American Experiment.