Economic growth in Minnesota’s urban areas is lagging our peers
Yesterday, the Bureau of Economic Analysis released the figures for 2016’s GDP growth in the nation’s Metropolitan Statistical Areas. They weren’t great for Minnesota.
Minnesota and the surrounding states
Let’s start by looking at how Minnesota’s MSAs compares to those of neighboring states.
Figure 1 shows the MSAs in Minnesota, Wisconsin, Iowa, South Dakota, and North Dakota ranked by GDP growth between 2001 and 2016. Mankato – a stellar performer in recent years – stands out, coming in fifth out of the thirty. But Minnesota has no other MSAs in the top ten. The next on the list is Rochester, at thirteen.
Figure 1: MSAs in Minnesota and neighboring states ranked by GDP growth, 2001-2016, (millions of 2009 dollars)
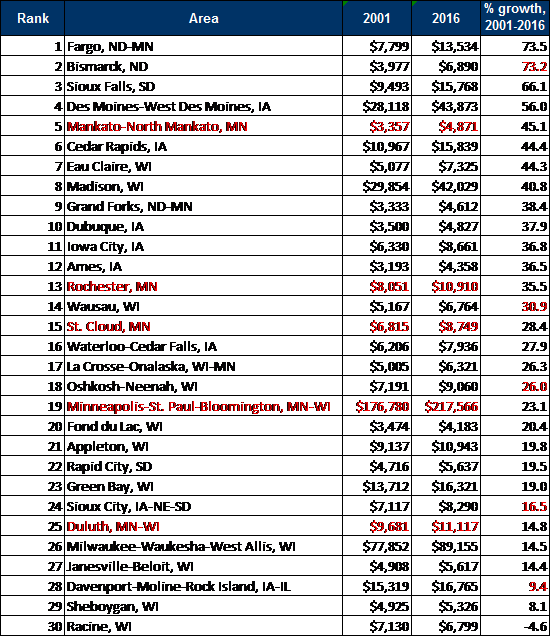
Source: Bureau of Economic Analysis and Center of the American Experiment
Sometimes it is objected that Minnesotan income growth rates are lower because growth levels are already higher. Some economists argue that jurisdictions converge to similar levels of GDP per capita. Aren’t we just seeing that?
Figure 2 suggests not. This shows the MSAs in the five states ranked by per capita GDP in 2001 and 2016. We can see that, in 2001, Minnesotans in these MSAs were not, on average, much better off than those of the neighboring states. Since then, there does not appear to have been much convergence.
Figure : MSAs in Minnesota and neighboring states ranked by real GDP per capita levels, 2001 and 2016, (millions of 2009 dollars)
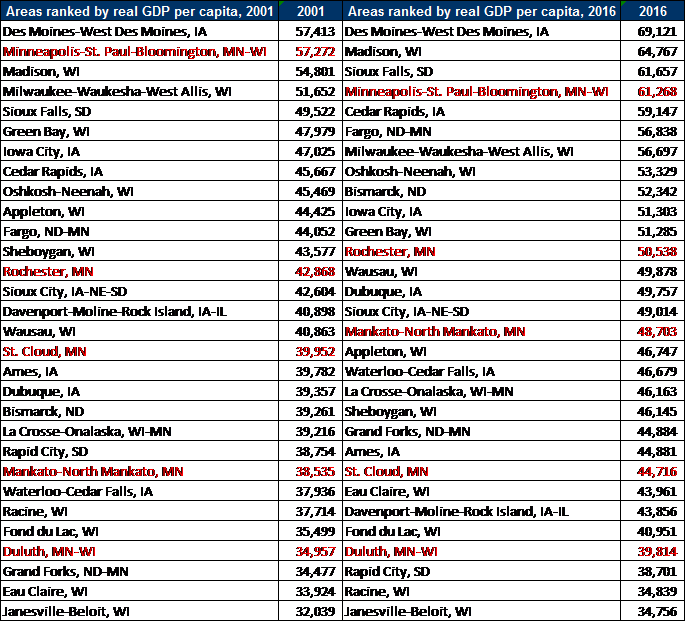
Source: Bureau of Economic Analysis and Center of the American Experiment
Minneapolis-St Paul and their peers nationwide
Isn’t it a little unfair to compare Minneapolis-St Paul-Bloomington to Fargo and Bismarck? Perhaps. So, let’s now compare it to its economic peers.
Figure 3 shows the GDP growth between 2001 and 2016 for the fifteen MSAs with the largest GDP in 2016. When we first complied this chart for 2001-2014, Minneapolis-St Paul-Bloomington was ranked ninth. It is now down to thirteenth.
Figure 3: GDP growth in the top fifteen MSAs nationwide by 2016 GDP, 2001-2016 (2009 dollars)
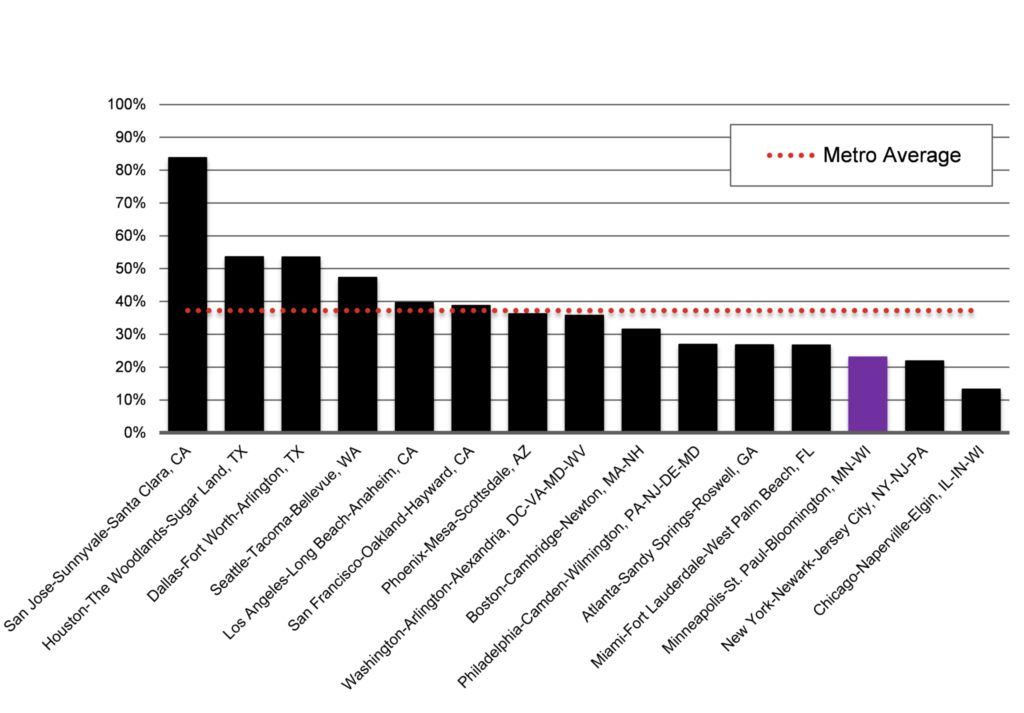
Source: Bureau of Economic Analysis and Center of the American Experiment
One of the MSAs propping up Minneapolis-St Paul in that last chart is Chicago. We are not in their situation nor that of Detroit, which has dropped out of this group since we first compiled it. Those cities have grave, long term, structural problems.
What this data does indicate is that we were correct in our assessment of Minnesota’s economy last year; mediocre. It is the same conclusion we reach in our forthcoming annual update. Watch this space.
John Phelan is an economist at Center of the American Experiment.