September employment data shows how Minnesota’s urban areas compare with neighboring states
Yesterday saw the release by the Bureau of Labour Statistics of its estimates of Metropolitan Area Employment and Unemployment for September.
As I’ve written previously, these can be a useful way to compare economic performance. Minnesota’s economy differs from those of near neighbors such as Iowa and North Dakota. This restricts the usefulness of comparisons of state level data. This variation is a little less pronounced between urban areas.
Minnesota and its neighbors
So what did the BLS data show?
Table 1 shows the 29 metropolitan areas in Minnesota and the neighboring four states ranked by the percentage point declines in their unemployment rates from September 2016 to September 2017. On this measure, Wisconsin (white areas) and Minnesota have both done well. Of the sixteen MSAs which have seen their unemployment rate fall fastest, ten were in the Badger State. Of Minnesota’s five MSAs, only one, Mankato, was among the bottom half of performers on this measure. Duluth, our state’s best performer, also lead the region.
Table 1
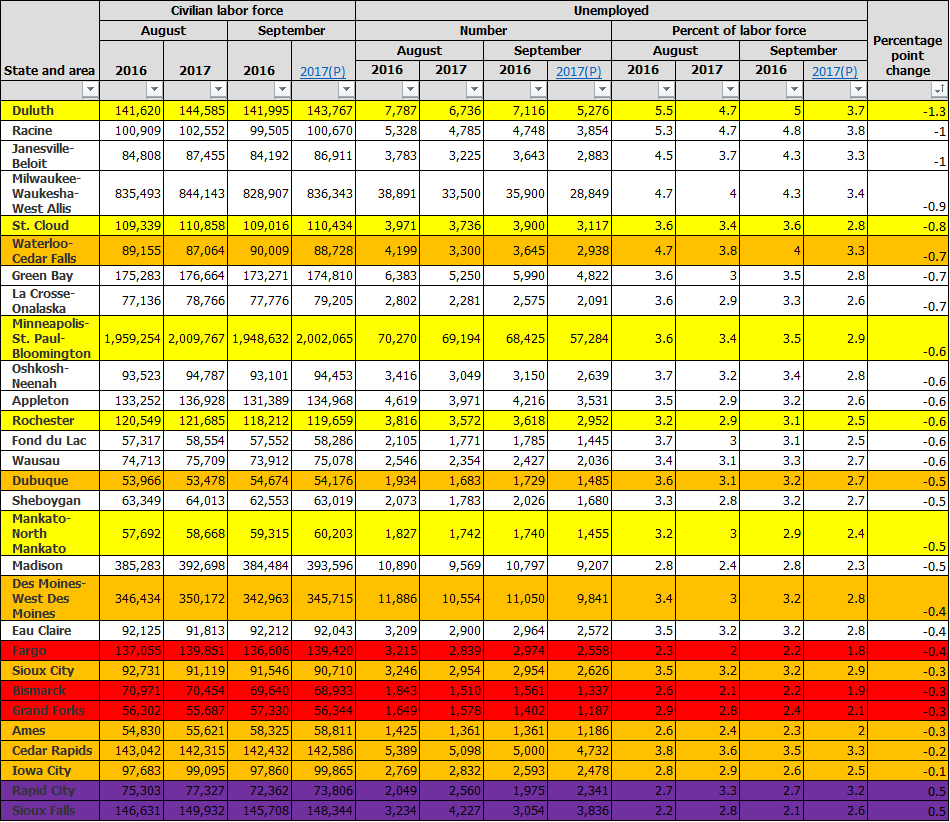
Source: Center of the American Experiment and the Bureau of Labor Statistics
Aren’t these results because unemployment was higher in these areas to start with so had further to fall?
There is some truth in that. Table 2 shows the 29 metropolitan areas ranked by their unemployment rates of September 2016. Of the ten MSAs with the highest unemployment rates, five were in Wisconsin. Even so, three of Minnesota’s five MSAs – Duluth, the Twin Cities, and St Cloud – had unemployment rates above the average of 3.2%.
Table 2
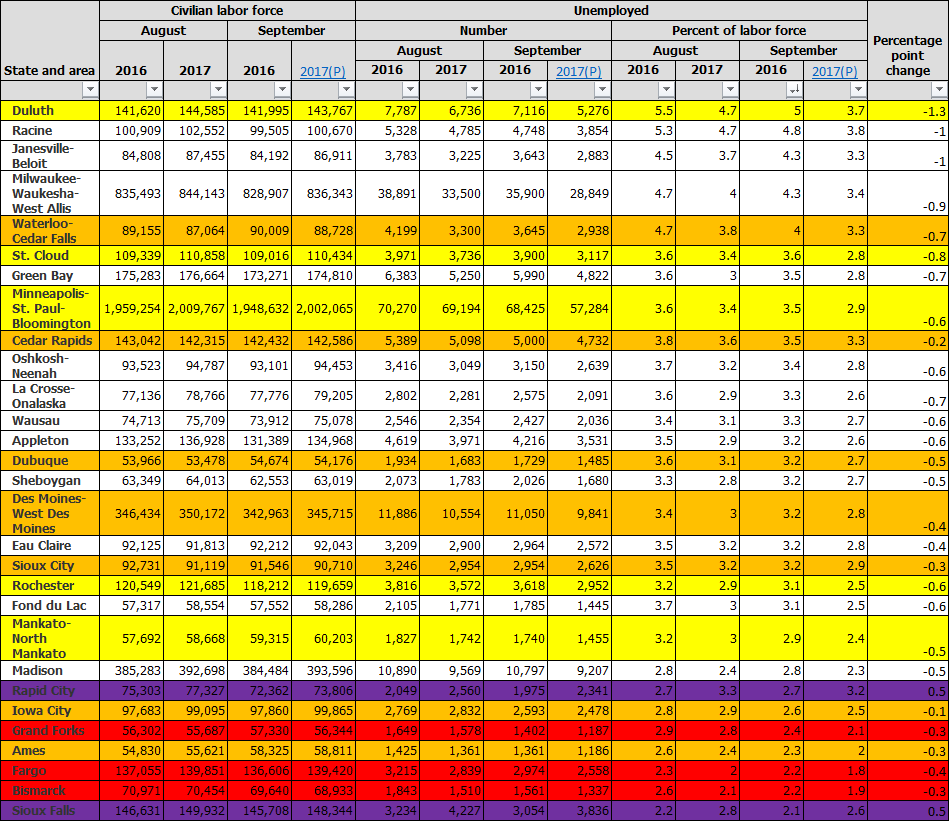
Source: Center of the American Experiment and the Bureau of Labor Statistics
Table 3 shows the 29 metropolitan areas ranked by their unemployment rates of August 2017. Wisconsin’s share of the worst performing ten is down from 50% to 30%. Minnesota’s, by contrast, has held steady at 30%. The same amount of Minnesotan MSAs are above the average – 2.7% – as there were last year.
Table 3
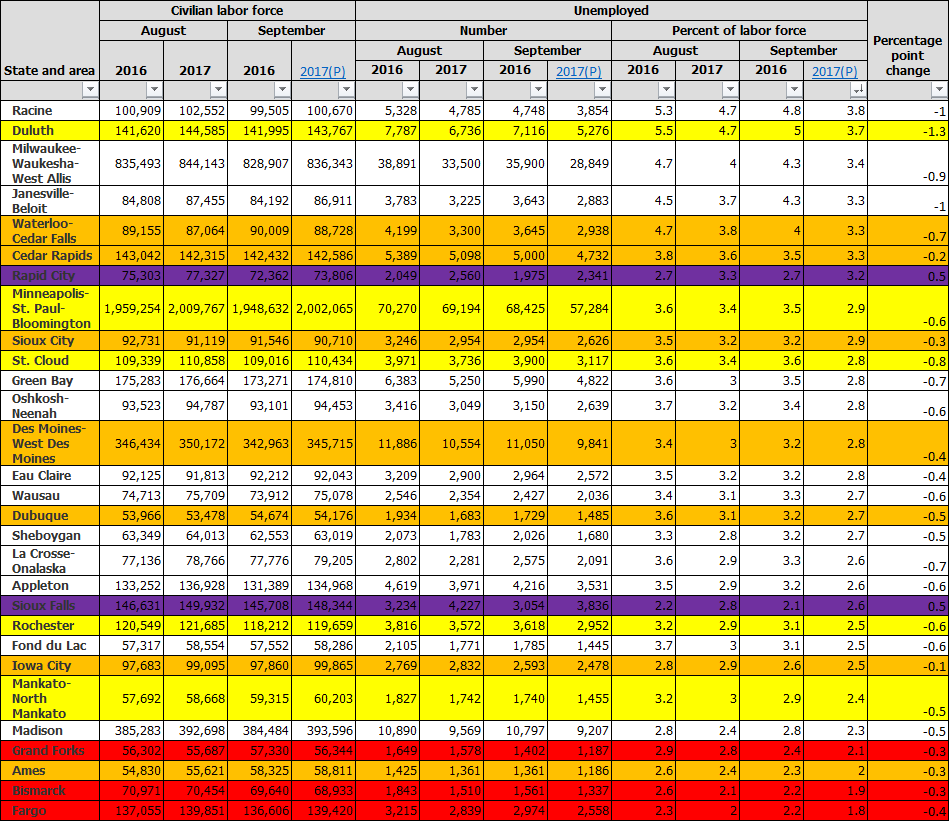
Source: Center of the American Experiment and the Bureau of Labor Statistics
With the previously mentioned caveats about state level data, let’s finish with a quick look at our state and its four neighbors in Table 4.
In September 2016, Minnesota had the second highest unemployment rate of the five states with Wisconsin’s higher. In September 2017, our state was up to second after North Dakota. What seems to have happened is that the rate in all the states has declined and a previously broad spread between the states (1.4 percentage points between Wisconsin and North Dakota) has narrowed (1.2 percentage points between South Dakota and North Dakota).
Table 4
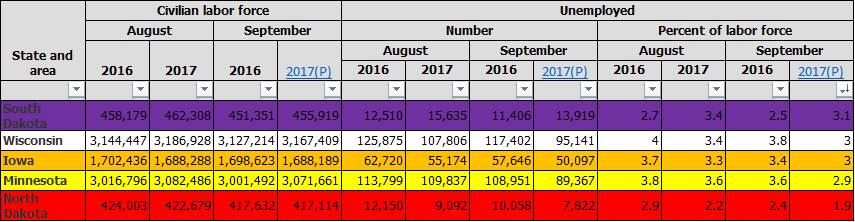
Source: Center of the American Experiment and the Bureau of Labor Statistics
Minnesotans cannot take their economy for granted
This is just one release from one data set. It would be ridiculous to infer impending economic doom from these numbers. But prosperity cannot be assumed, it must be nurtured. To do this, we have to keep a close eye on all the indicators of economic health.
John Phelan is an economist at Center of the American Experiment.