Gov. Dayton overstates his economic achievements
Last Wednesday, Gov. Mark Dayton gave his final state of the state speech. He took the opportunity to pat himself on the back, claiming that, during his time in office,
…Minnesota’s total job creation, average household income, and state economic output have improved steadily – both in real terms and relative to other states.
Fortunately, we are able to check these claims against the data. Sadly, the data do not support Gov. Dayton’s self-congratulations.
Job creation
On job creation, Minnesota has actually lagged the national average since Gov. Dayton took office. Figure 1 uses data from the Bureau of Labor Statistics to show the growth in employment in Minnesota and the United States generally since January 2011, when Gov. Dayton took office. Over that period, Total Nonfarm employment in the US has grown by 12.2%. In Minnesota, the figure is 10.7%. The relative situation seems to have deteriorated since late 2014.
Figure 1 – Growth in employment, United States and Minnesota, January 2011 to January 2018, January 2011 = 100
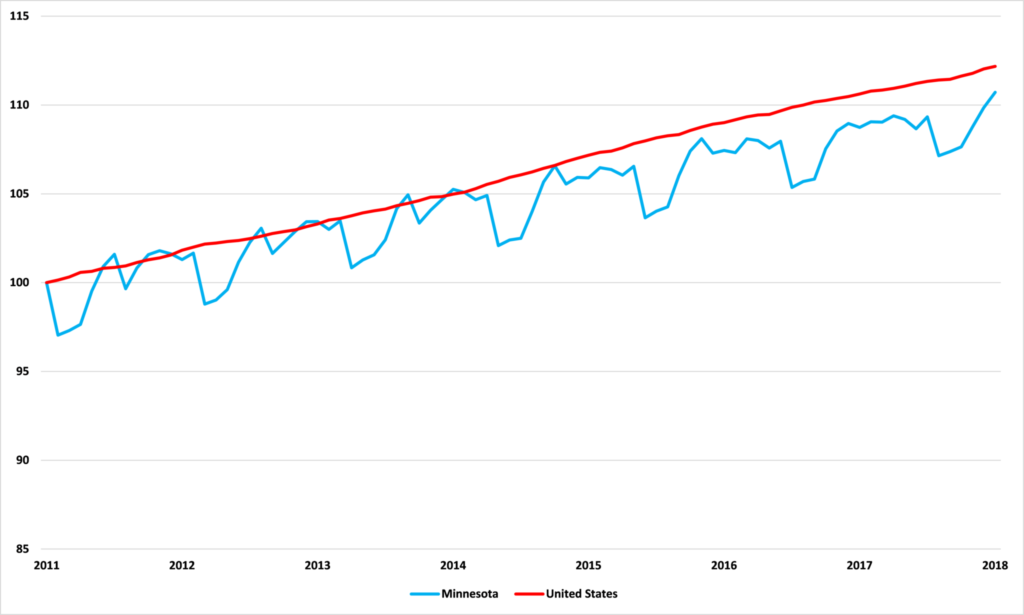
Source: Bureau of Labor Statistics
Household incomes
As we wrote in our recent report, The State of Minnesota’s Economy: 2017, it is true, as Gov. Dayton says, that Minnesota’s household incomes are above the national level, as Figure 2 shows. We should note, however, that from 125.3% of the US level in 2014, Minnesota’s household incomes have fallen, relatively, to 118.9% of the national level in 2016.
Figure 2 – Median household income, 2011 to 2016, $2016
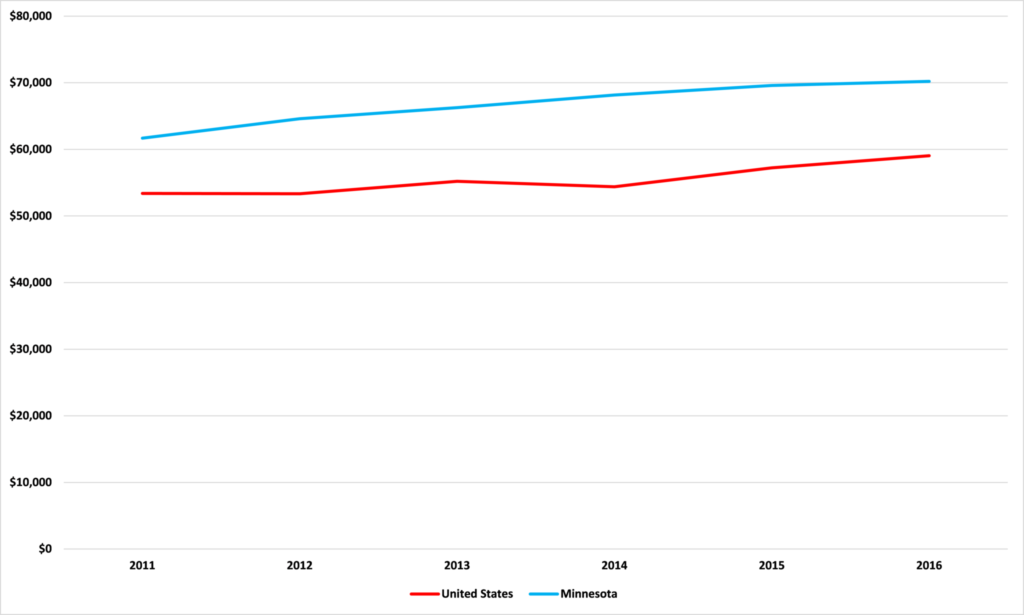
Source: Census Bureau
But, as we also noted in our report, this is largely a function of Minnesotan households containing more workers, not of Gov. Dayton’s big government economic policies. As Figure 3 shows, Minnesota has a smaller share of households with no workers or only one worker in them than the US generally. But, our state has more households with two workers and three or more workers. More workers in a household generally means higher household incomes.
Figure 3 – Proportion of households by number of workers, 2016
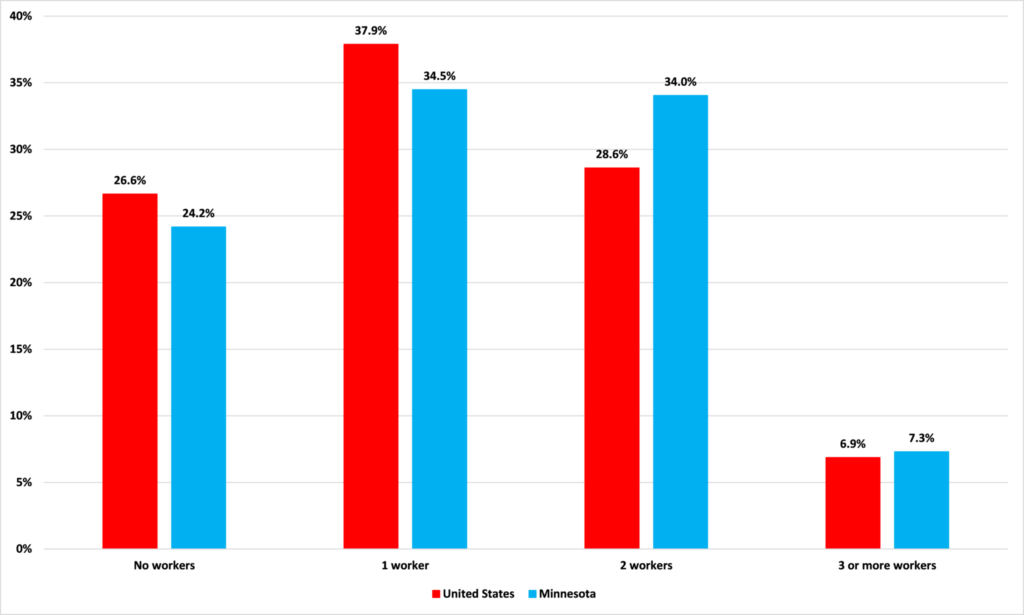
Source: Census Bureau
GDP growth
On GDP growth, Minnesota has tracked the national rate fairly closely over Gov. Dayton’s term. As Figure 4 shows, using data from the Bureau of Economic Analysis, Minnesota’s real GDP is 0.5% higher than it would have been if it had exactly matched the US rate since January 2011.
Figure 4 – Quarterly real GDP growth, 2011:Q1 = 100
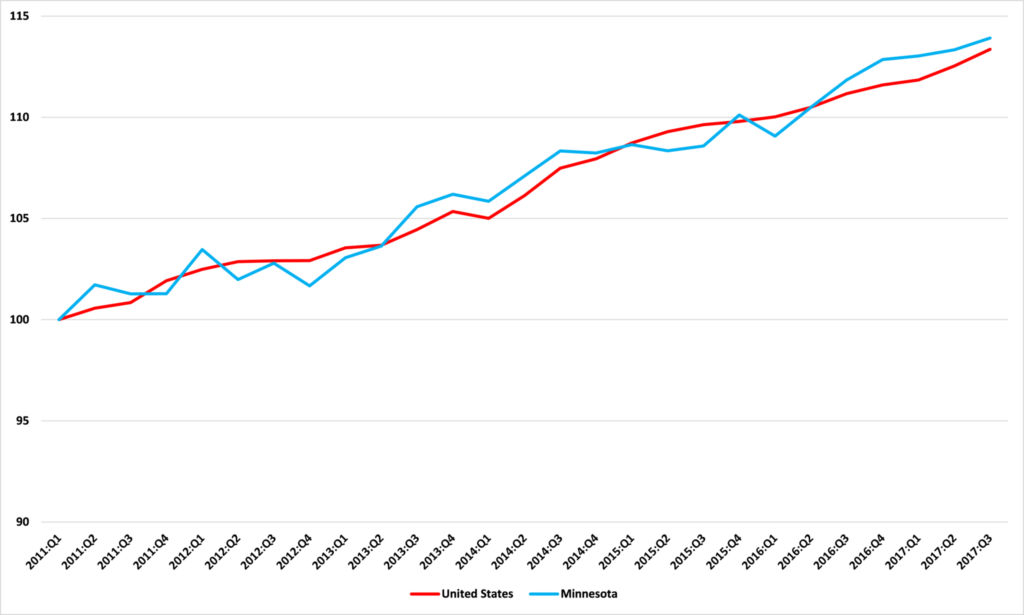
Source: Bureau of Economic Analysis
But this, again, is a result of more Minnesotans working, not of Gov. Dayton’s tax-and-spend policies. Our state’s Labor Force Participation rate is 71.2%, the second highest in the nation, according to the Bureau of Labor Statistics. For the US generally, that figure stands at just 62.9%. It stands to reason that with a greater share of our population working to produce goods and services, there are more of those goods and services (GDP) around.
The real sources of Minnesota’s prosperity
Gov. Dayton sought to take credit for Minnesota’s high household incomes and (slightly) above average GDP growth. But the data shows that it is not Gov. Dayton to whom Minnesotans owe their standard of living, but to their own lifestyles. Minnesotans work hard. Each household has lots of workers, which drives household incomes. It also drives the high Labor Force Participation rates which, in turn, propel the state’s economic growth. Minnesotans should be proud of their own work ethic, not grateful for Gov. Dayton’s taxing and spending of their money.
John Phelan is an economist at the Center of the American Experiment.