New employment data shows that Minnesota has the second highest unemployment rate in the region
Today sees the release by the Bureau of Labor Statistics of its estimates of Metropolitan Area Employment and Unemployment.
These can be a useful way to compare economic performance. Minnesota’s economy differs from those of neighbors such as Iowa and North Dakota, even Wisconsin. As a result, comparisons of state level data are of limited use. This variation, while still present, is a little less pronounced between urban areas.
Minnesota and its neighbors
So what did the BLS data show?
Table 1 shows the 29 metropolitan areas in Minnesota and the neighboring four states ranked by their unemployment rates for April 2018. On this measure, Iowa (orange) and Wisconsin (white) are the star performers. Between them, they account for 13 of the 14 MSAs with the lowest unemployment rates. Only Mankato breaks their stranglehold. The Dakotas don’t fare too well, with all 4 of their MSAs in the bottom 11.
Table 1
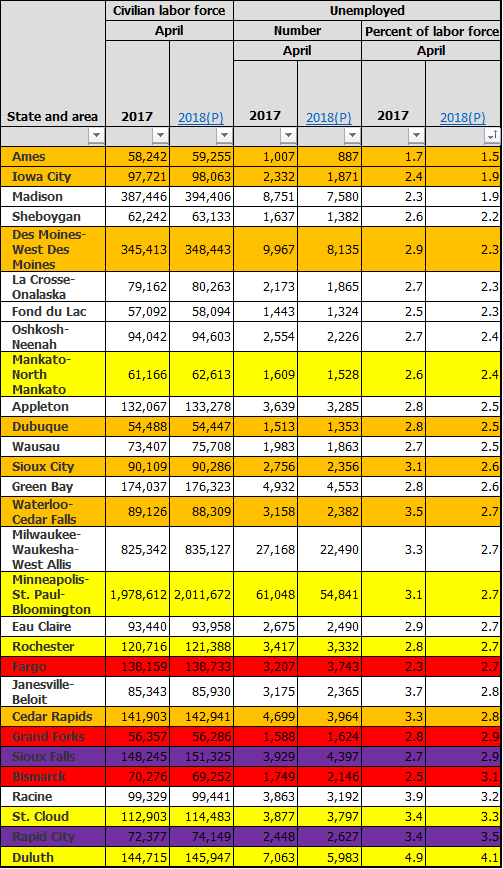
Source: Bureau of Labor Statistics
It should be pointed out that in almost all cases we are talking about small numbers here. The April 2018 average for MSAs nationwide is 4.0%, and only one of our 29 MSAs, Duluth, is above that.
But what about the job numbers themselves? The unemployment rate is just the share of the civilian labor force (potential workers), not currently in work. If the number of potential workers grows more rapidly than the number of actual workers, unemployment will rise even if the number of people employed continues to increase. What we want to see is the number of actual workers growing at a faster rate than the number of potential workers.
Table 2 shows the 29 MSAs ranked by the percentage point difference between the percentage increase in the civilian labor force and the percentage increase in employment between April 2017 and April 2018. So, for example, in Duluth the civilian labor force grew by 0.9% over this period. Over the same period, the number of those people working increased by 1.7% giving a 0.8 percentage point gap.
Overall Minnesota fares poorly here. Not as badly as the Dakotas, where in each of their 4 MSAs the number of potential workers rose at a faster rate than the number of actual workers, but badly enough that three of our state’s 5 MSAs rounded out the bottom seven. In those places the rate of increase in actual workers is only slightly above the rate of increase in potential workers meaning slow progress on reducing unemployment rates. And remember, in terms of rates, St. Cloud and Rochester are towards the bottom of Table 1.
Table 2
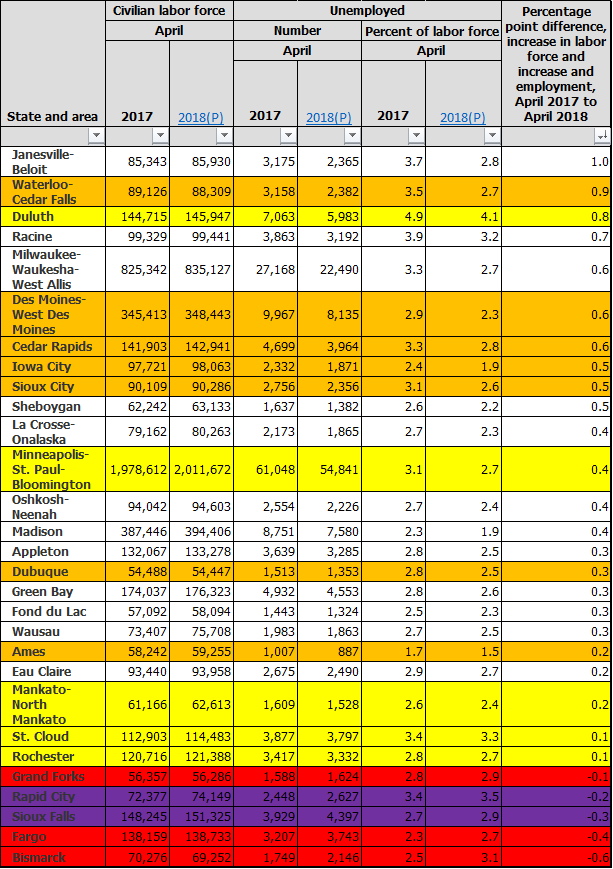
Source: Bureau of Labor Statistics
With the previously mentioned caveats about state level data, let’s finish with a quick look at our state and its four neighbors. Table 3 shows Minnesota and its neighbors ranked by their unemployment rates in April 2018. We see that in Minnesota had the second highest unemployment rate among the five states.
Table 3
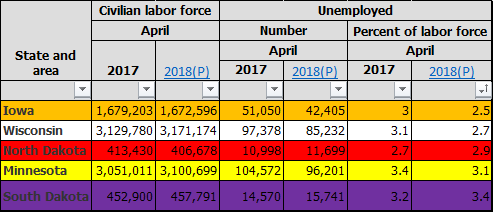
Source: Bureau of Labor Statistics
What do we see if we look at the state level data for the growth of potential workers relative to the growth of actual workers?
Table 4 shows the five states ranked by the percentage point difference between the percentage increase in the civilian labor force and the percentage increase in employment between April 2017 and April 2018. Again, the Dakotas prop up the table with the growth rate of potential workers exceeding that of actual workers. Iowa seems to do best, but this is really a result of its pool of potential workers contracting by 0.4%. In Minnesota and Wisconsin both the numbers of potential and actual workers increased, but Wisconsin did a better job of finding jobs for its new potential workers.
Table 4
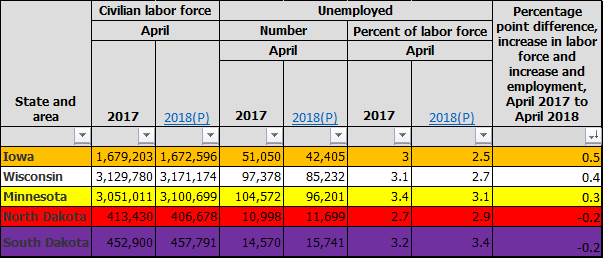
Source: Bureau of Labor Statistics
John Phelan is an economist at the Center of the American Experiment.