In the late 1990s, Minnesota cut its top rate of income tax. What happened to income tax revenues?
On Monday, I wrote about the effects on income tax revenues of cuts in income tax rates in Minnesota in the 1980s. We saw that the lower rates were associated with higher revenues, both in dollar terms and, slightly, as a share of state GDP. Minnesota cut its top rate of income tax further, in the late 1990s. Wheat were the revenue effects then?
1998 to 2000
Department of Revenue data shows that between 1998 and 2000, Minnesota’s top rate of income tax was cut from 8.5% to 7.85%, where it remained until 2012.
In nominal terms, income tax revenues actually rose from $4.7 billion in 1998 to $5.6 billion in 2000. In real terms (2017 $), this meant a rise from $7.1 billion in 1998 to $7.9 billion in 2000. In fact, in 2017 dollars, income tax revenues in the nine years before 1998, when the top rate of income tax was at least 8.5%, averaged $5.8 billion. In the nine years after 2000, when the top rate of income tax was 7.85%, they averaged $7.8 billion. Figure 1 illustrates this.
The same is true if we look at income tax revenues as a share of state GDP. As a share of Minnesota’s GDP, income tax revenue edged up from from 2.8% in 1998 to 2.9% in 2000. In the nine years before 1998, when the top rate of income tax was at least 8.5%, Minnesota’s income tax revenues had averaged 2.8% of state GDP. In the nine years after 2000, when the top rate of income tax was 7.85%, Minnesota’s income tax revenues averaged 2.7% of state GDP. Again, Figure 1 illustrates this.
Figure 1: Minnesota income tax revenues, 2017 $ and as a % of state GDP, 1997 to 2001
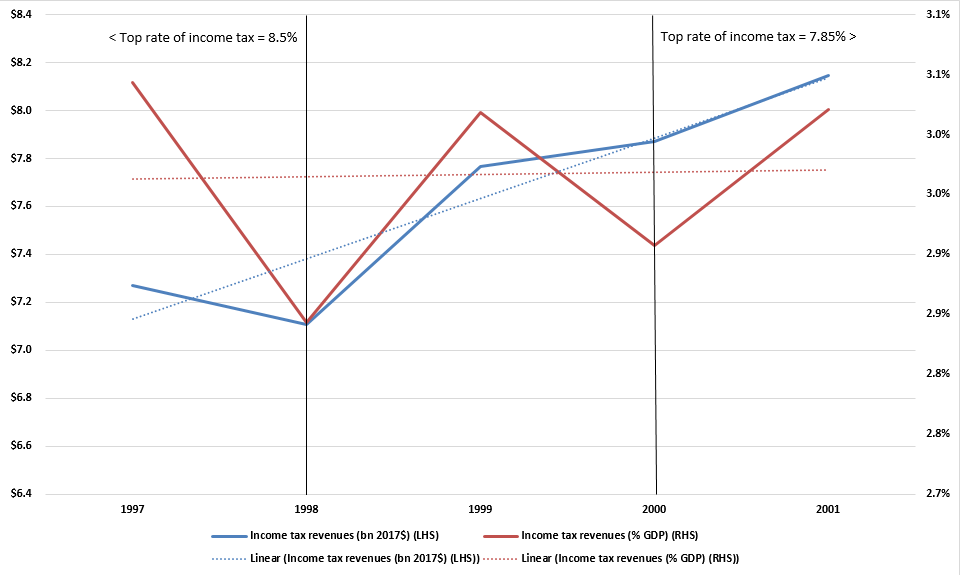
Source: Minnesota Department of Revenue
What is striking, as I’ve written previously, is the stability of income tax revenue as a share of state GDP. Going back to 1974,
…The mean average is 2.8% of state GDP, the median is 2.7% of state GDP. The same is true of revenue more broadly, both the mean average and the median of state tax revenues as a share of GDP come in at 6.6%. In other words, there is very little variation in these numbers.
This is in spite of state tax policy. In the 1970s and into the 1980s, Minnesota’s politicians tried to claim a large share of their citizen’s income with top rates of tax of up to 17%. But Minnesotans did not respond to these rates by handing over a greater share of their money, as shown by the stability of the revenue line. Indeed, they handed over a larger share of their incomes to the government in the 1990s with tax rates of 9% than they did in the 1970s with rates of 17%.
There is an important policy lesson here. The dollar amount of tax revenue seems far more likely to be a function of the size of the state’s economy than of its tax rates. This means that if you want more money to fund government services, you are better off looking to increase the state’s GDP than its tax rates.
John Phelan is an economist at the Center of the American Experiment.