Doubling Down On Failure Installment Three: Carbon Dioxide Emissions
This article is the third installment explaining the findings of our new study entitled Doubling Down on Failure, How a 50 percent by 2030 Renewable Energy Standard Would Cost Minnesota $80.2 Billion.
This installment explains how carbon dioxide emissions would be affected in each of the four scenarios we examine, Renewable, Short-Term Nuclear, Long-Term Nuclear, and Affordable Clean Energy (ACE).
While the Renewable, Short-Term Nuclear, and Long-Term Nuclear scenarios would impose significant yearly financial burdens on Minnesota households, they all would reduce carbon dioxide emissions from power plants. Emissions would eventually rise under the ACE plan as existing wind turbines reach the end of their useful lives. The graph below shows the annual emissions profile of all four scenarios.
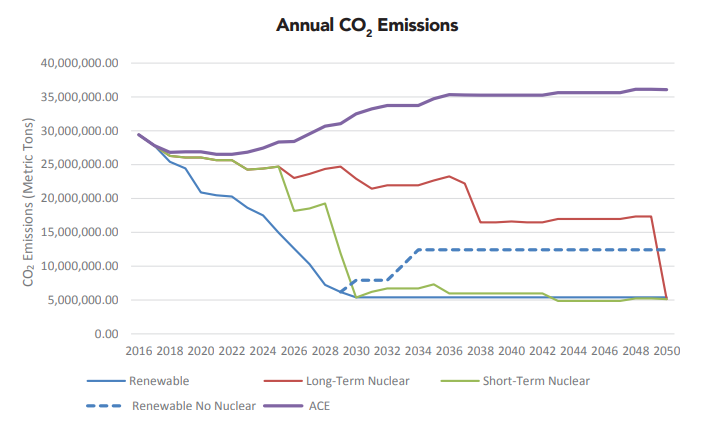
As you can see, both the Renewable scenario and the Short-Term Nuclear scenario would dramatically reduce Minnesota’s carbon dioxide emissions by 2030. The reductions in the Renewable scenario are based off planning documents used by public utility companies, like Xcel Energy, Minnesota Power, and Otter Tail Power, and also co-op’s like Great River Energy. We assume each of these entities would replace their wind turbines after they have reached the end of their useful 20 year lives.
The Short-Term Nuclear scenario takes a little longer to reduce emissions down to approximately 5 million metric tons per year due to longer planning horizons for nuclear power, and because waiting to build nuclear power reduced the costs paid by consumers by allowing them to use affordable, reliable, coal-fired power plants for a few years longer.
Interestingly, the dotted line shows that carbon dioxide emissions would increase substantially in the Renewable scenario if Minnesota’s two existing nuclear power plants were closed.
Emissions decrease in the Long-Term Nuclear scenario as Minnesota’s existing coal-fired power plants are gradually replaced with nuclear power after they have reached the end of their useful lifetimes, which is why this scenario has the lowest cost of any scenario that reduces carbon dioxide emissions over the course of our study. Lastly, emissions increase in the ACE scenario, as coal-fired power plants generate a larger percentage of electricity in Minnesota.
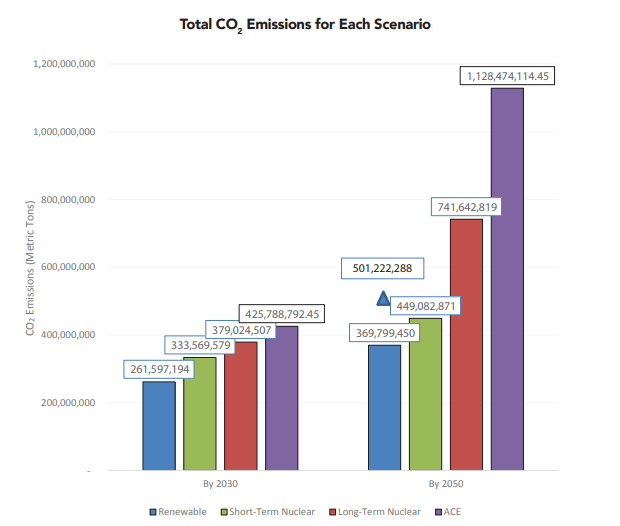
The figure below shows the total CO2 emissions by scenario. The blue triangle in the figure below shows what CO2 emissions would look like in the Renewable scenario if Minnesota’s existing nuclear plants are allowed to close. Emissions are highest in the ACE scenario, but this is the most affordable scenario because its reduces customer costs by nearly $7.5 billion through 2050.
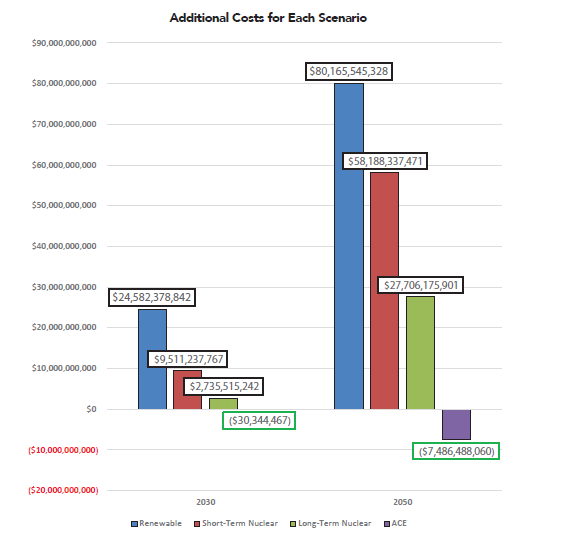
These graphs underscore one key point: reducing carbon dioxide emissions in Minnesota will be very expensive. Anyone who tells you otherwise is not giving you the whole story.