Below average growth since 2010 has cost $1,418 for every Minnesotan
Yesterday, I wrote about new data from the Bureau of Economic Analysis which showed that, in 2018, Minnesota had the 22nd fastest growing economy in the US, down from 14th in 2017.
This was the second year in a row that Minnesota’s economic growth has lagged that of the US generally. In 2016, the US economy grew by 1.6% in real terms while Minnesota’s grew by 2.0%. But, in 2017, national growth surged to 2.2% while our edged up to 2.1% and last year, while the US economy achieved growth of 2.9%, here was saw growth of 2.2%, as shown in Table 1.
Table 1: Real GDP growth rates

Source: Bureau of Economic Analysis
So what? One swallow doesn’t make a summer, as they say, and two might not even make a warm spring day. But such shortfalls in growth rates, compounded over time, add up.
In our annual economy report, we compare the growth of GDP in Minnesota with the national growth rate from 2000 to whichever is the most recent year we have data for. We index GDP for both at 100 in 2000 and apply the percentage growth rates in subsequent years. This gives us Figure 1. It shows that, so far this century, the US economy has grown by 41.7% in real terms while Minnesota’s economy has grown by 34.7%. If we applied the post-2000 growth rates of US GDP to Minnesota’s GDP of 2000, then, in real terms, our state’s GDP would have been 5.2% higher than it actually was in 2018 – $17.3 billion, or $3,080 per Minnesotan.
Figure 1: GDP growth in the US and Minnesota, 2000-2018 (2000=100)
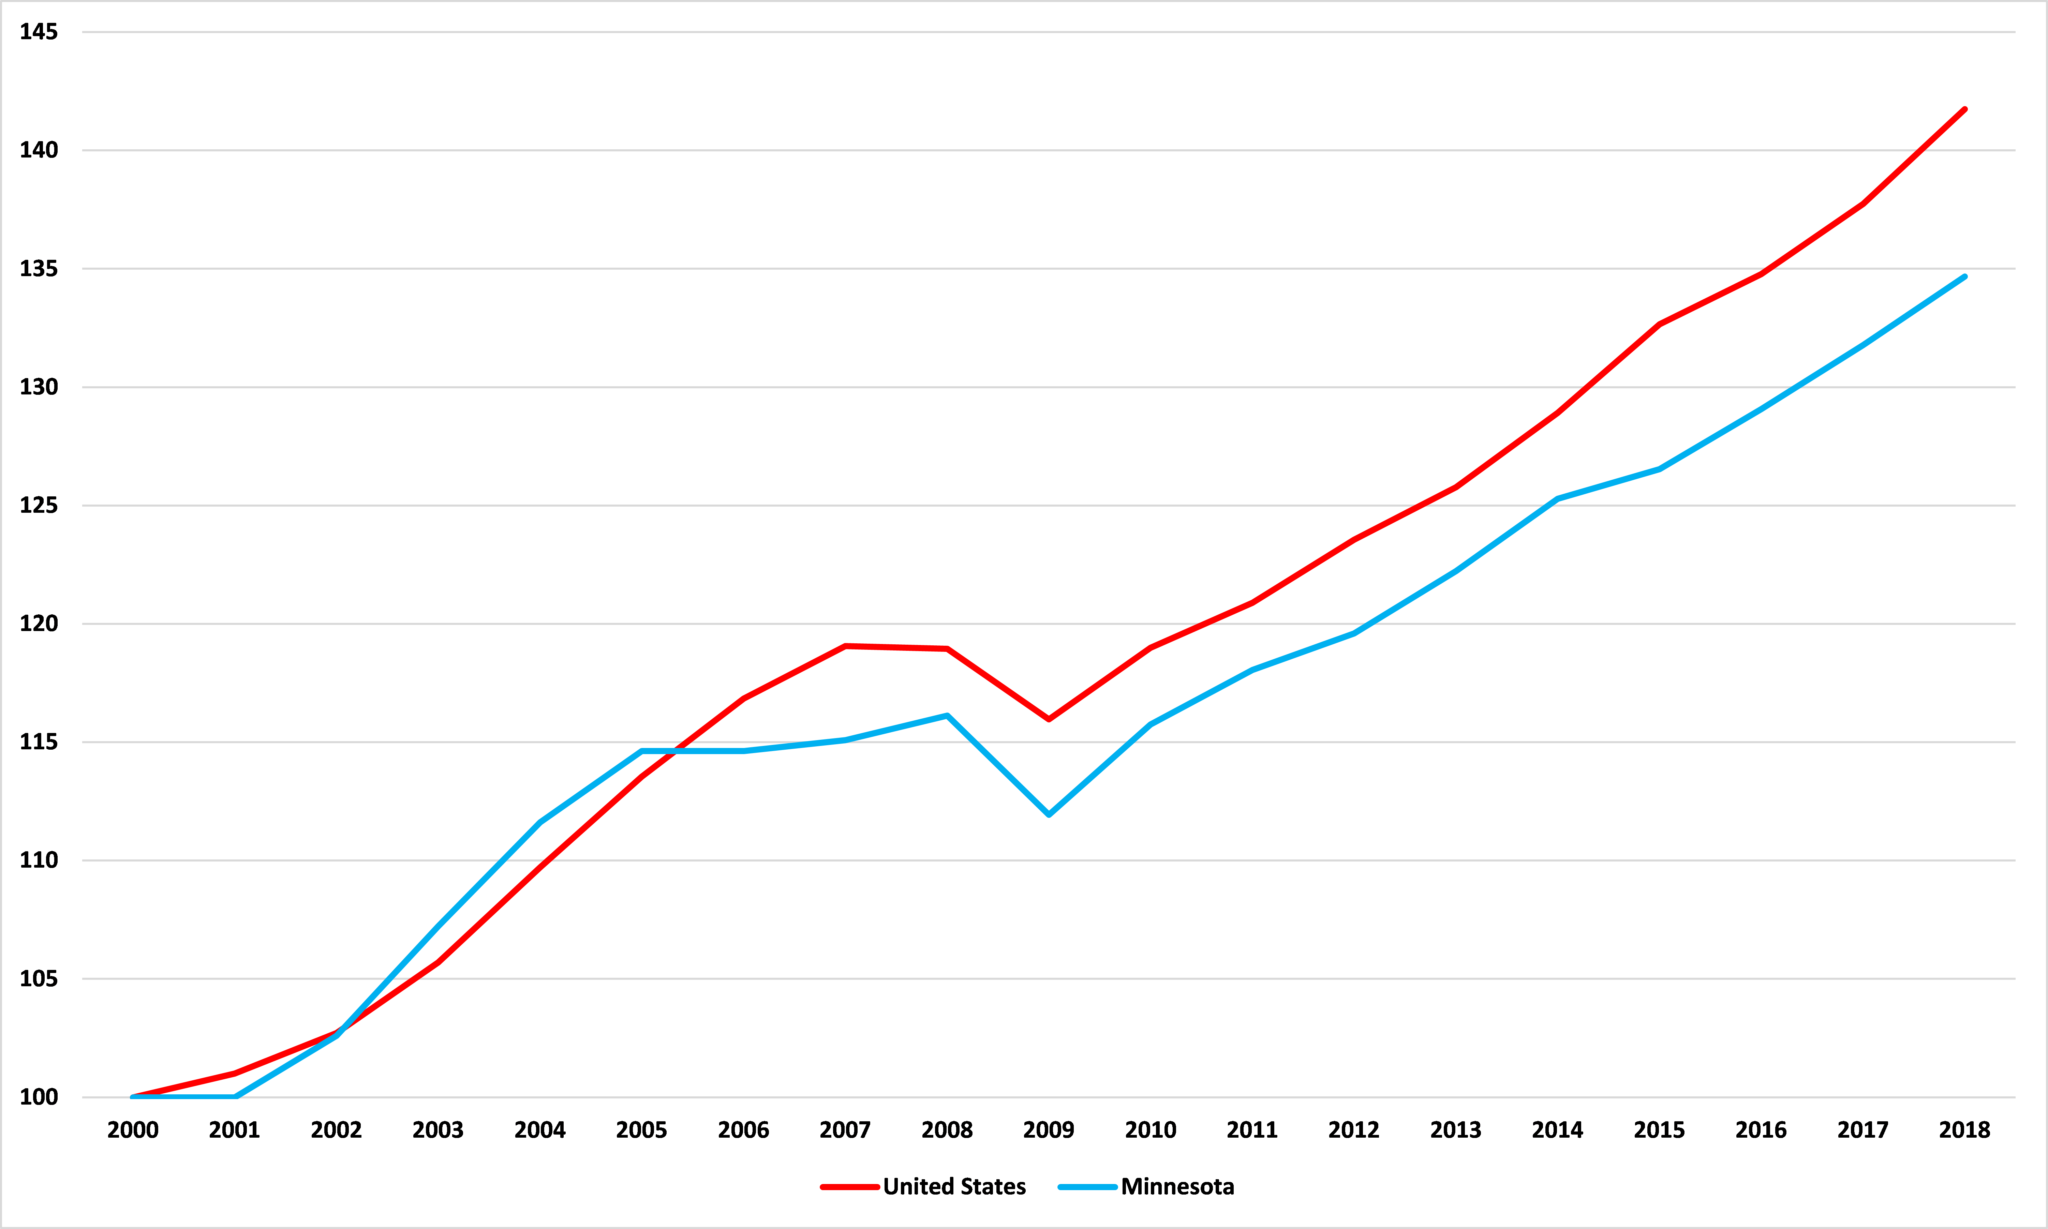
Source: Bureau of Economic Analysis
We see a similar story in more recent trends. If we do the same exercise as above for numbers for 2010 onward, we get Figure 2. We see that, between 2010 and 2014, Minnesota’s GDP growth tracked that of the US generally. In real terms, US economic growth was 8.3% over the period compared to 8.2% in Minnesota. But after 2014, initially as a result of slower growth in Minnesota (2014-2015) and lately as a result of faster growth nationally (2017-2018), the lines have diverged. Overall, since 2010, real terms economic growth in the US was 19.1% compared to 16.3% in Minnesota. If we had matched national growth rates over the period, GDP in 2018 would have been 2.4% higher than it was – $8.0 billion or $1,418 per Minnesotan.
Figure 2: GDP growth in the US and Minnesota, 2010-2018 (2010=100)
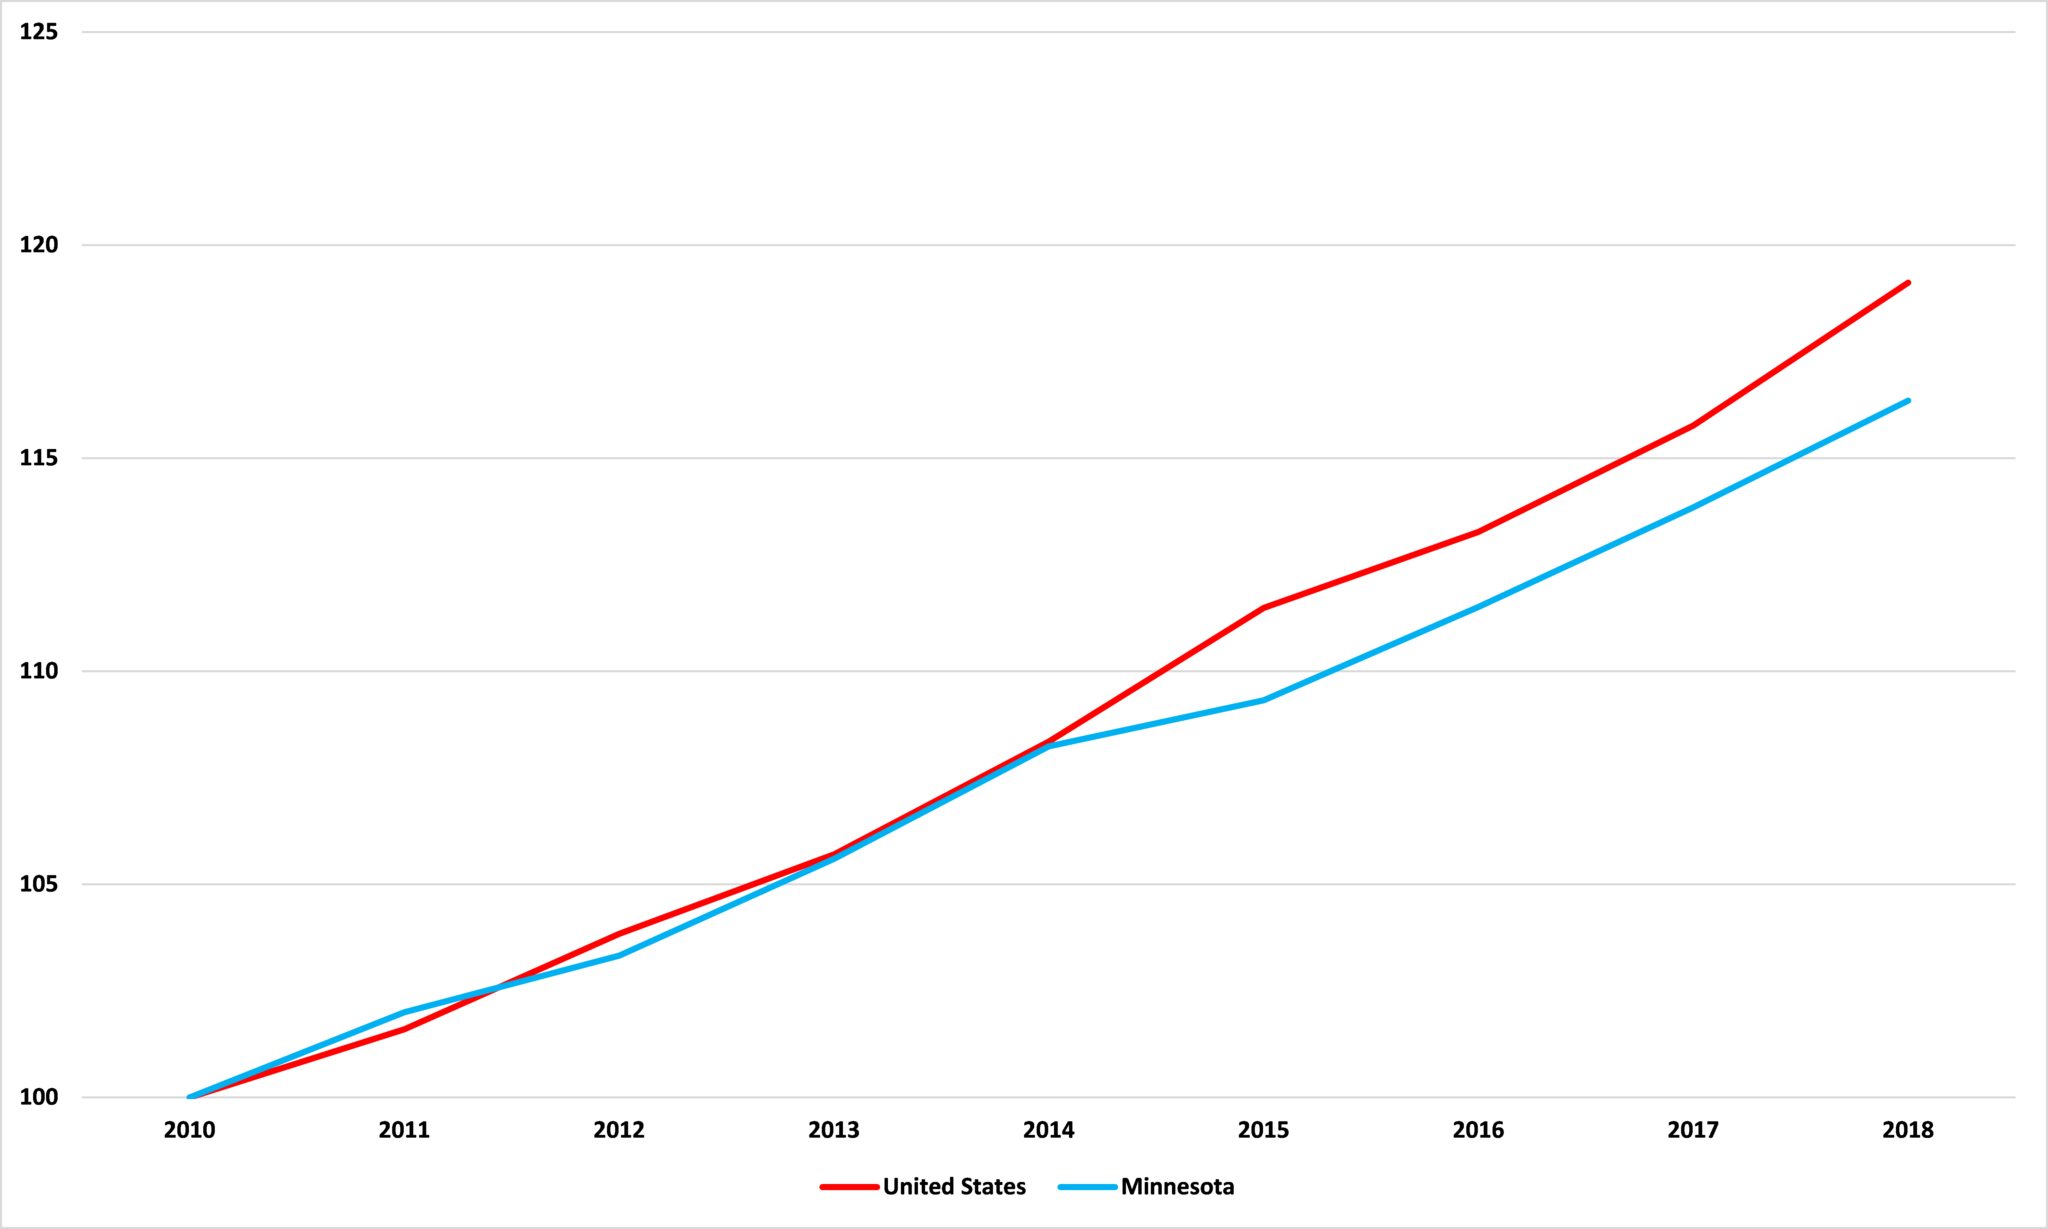
Source: Bureau of Economic Analysis
It will probably be argued that these figures are the result of ‘convergence’, that Minnesota’s economy is growing at a below average rate because the state is already rich. This is not supported by the evidence.
John Phelan is an economist at the Center of the American Experiment.