A growing economy is in the interests of all Minnesotans
An article in the Star Tribune this week notes that ‘Amid budget noise, Minnesota’s government grows about the same speed as the economy‘. As the article points out,
From 1999 through 2018, the state’s general fund — which legislators control and was at the crux of the compromise with Gov. Tim Walz over the last two weeks — grew at an average annual pace of 4.15%.
The state economy grew at an average annual rate of 4.08% in that period.
As a result, General Fund spending hasn’t changed much as a share of the state’s economy. Numbers from the Bureau of Economic Analysis for Minnesota’s GDP (Gross Domestic Product or Gross State Product) show that, adjusted for inflation, it has increased by 39.9% since 1999. Data from Minnesota Management and Budget shows that, over the same period, again in real terms, General Fund spending increased by 35.0%.
As Figure 1 illustrates, this means that General Fund spending has averaged 6.1% of state GDP since 1999. All Funds spending has exhibited a slight increase as a share of GDP, but has averaged 10.2% over the same period.
Figure 1: Minnesota General Fund and All Funds spending as a % of state GDP, 1997-2018
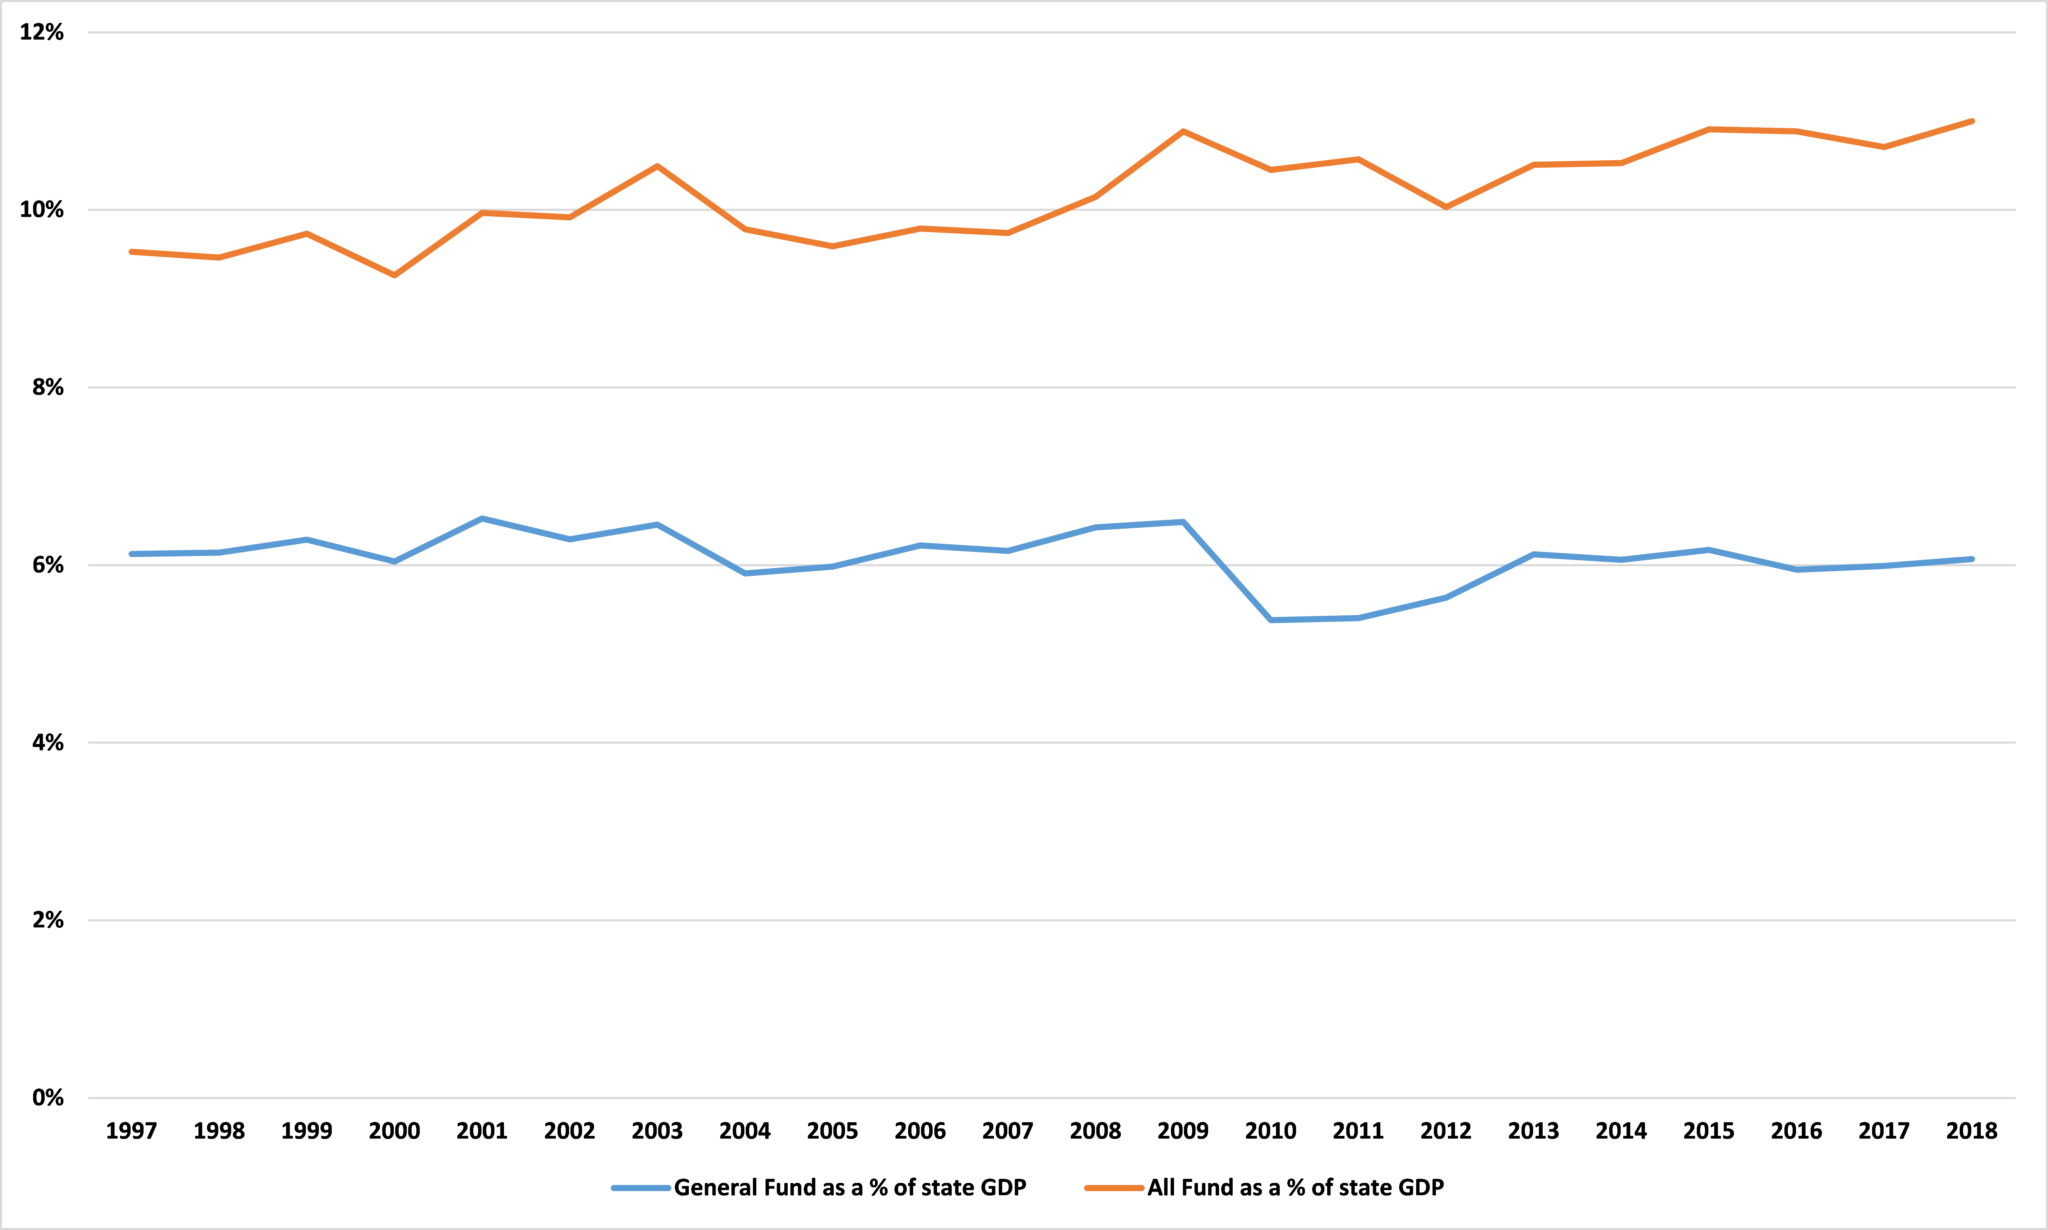
Source: Bureau of Economic Analysis and Minnesota Management and Budget
We have commented on this steady relationship of a particular variable with GDP before. In that case, it was state income tax revenues. Figure 2 shows the top rate of Minnesota’s state income tax going back to 1974 and the total state income tax collections as a share of GDP. What is striking is the stability of the revenue line. The mean average is 2.8% of state GDP, the median is 2.7% of state GDP. The same is true of revenue more broadly, both the mean average and the median of state tax revenues as a share of GDP come in at 6.6%. In other words, there is very little variation in these numbers.
This is in spite of state tax policy. In the 1970s and into the 1980s, Minnesota’s politicians tried to claim a large share of their citizen’s income with top rates of tax of up to 17%. But Minnesotans did not respond to these rates by handing over a greater share of their money, as shown by the stability of the revenue line. Indeed, they handed over a larger share of their incomes to the government in the 1990s with tax rates of 9% than they did in the 1970s with rates of 17%.
Figure 2: Top rate of state income tax % (LHS) and Total state income tax collections % of state GDP (RHS)

Source: Minnesota Department of Revenue and the Bureau of Economic Analysis
There is an important policy lesson here. The dollar amount of tax revenue seems far more likely to be a function of the size of the state’s economy than of its tax rates. This means that if you want more money to fund government services, you are better off looking to increase the state’s GDP than its tax rates.
John Phelan is an economist at the Center of the American Experiment.