Third light rail accident in two weeks highlights Twin Cities Light Rail as the least safe in the country
Monday afternoon saw the Twin Cities third light rail accident in the last two weeks. As MPR News reports,
A man walking on tracks along the Green Line light rail line in St. Paul was struck by a passing train…
His condition wasn’t immediately available, although initial indications were that his injuries were not fatal, according to Metro Transit spokesman Drew Kerr.
While there seems to be good news in this case, MPR News noted
A previous Green Line crash killed Hanue Salahdin Sikar, 21, on Aug. 30, when she was struck by a train near the Dale Street Station. A bicyclist, John Edward Casey, 53, was killed Sept. 2, when he drove his bike in front of an oncoming Blue Line train at the 35th Street crossing in Minneapolis.
As Figure 1 shows, these two fatalities mean that the Twin Cities has now experienced as many in 2019 as it has in any year except 2014, when Green Line trains opened to the public.
Figure 1: Metro Transit light rail accidents involving pedestrians, 2014-2019
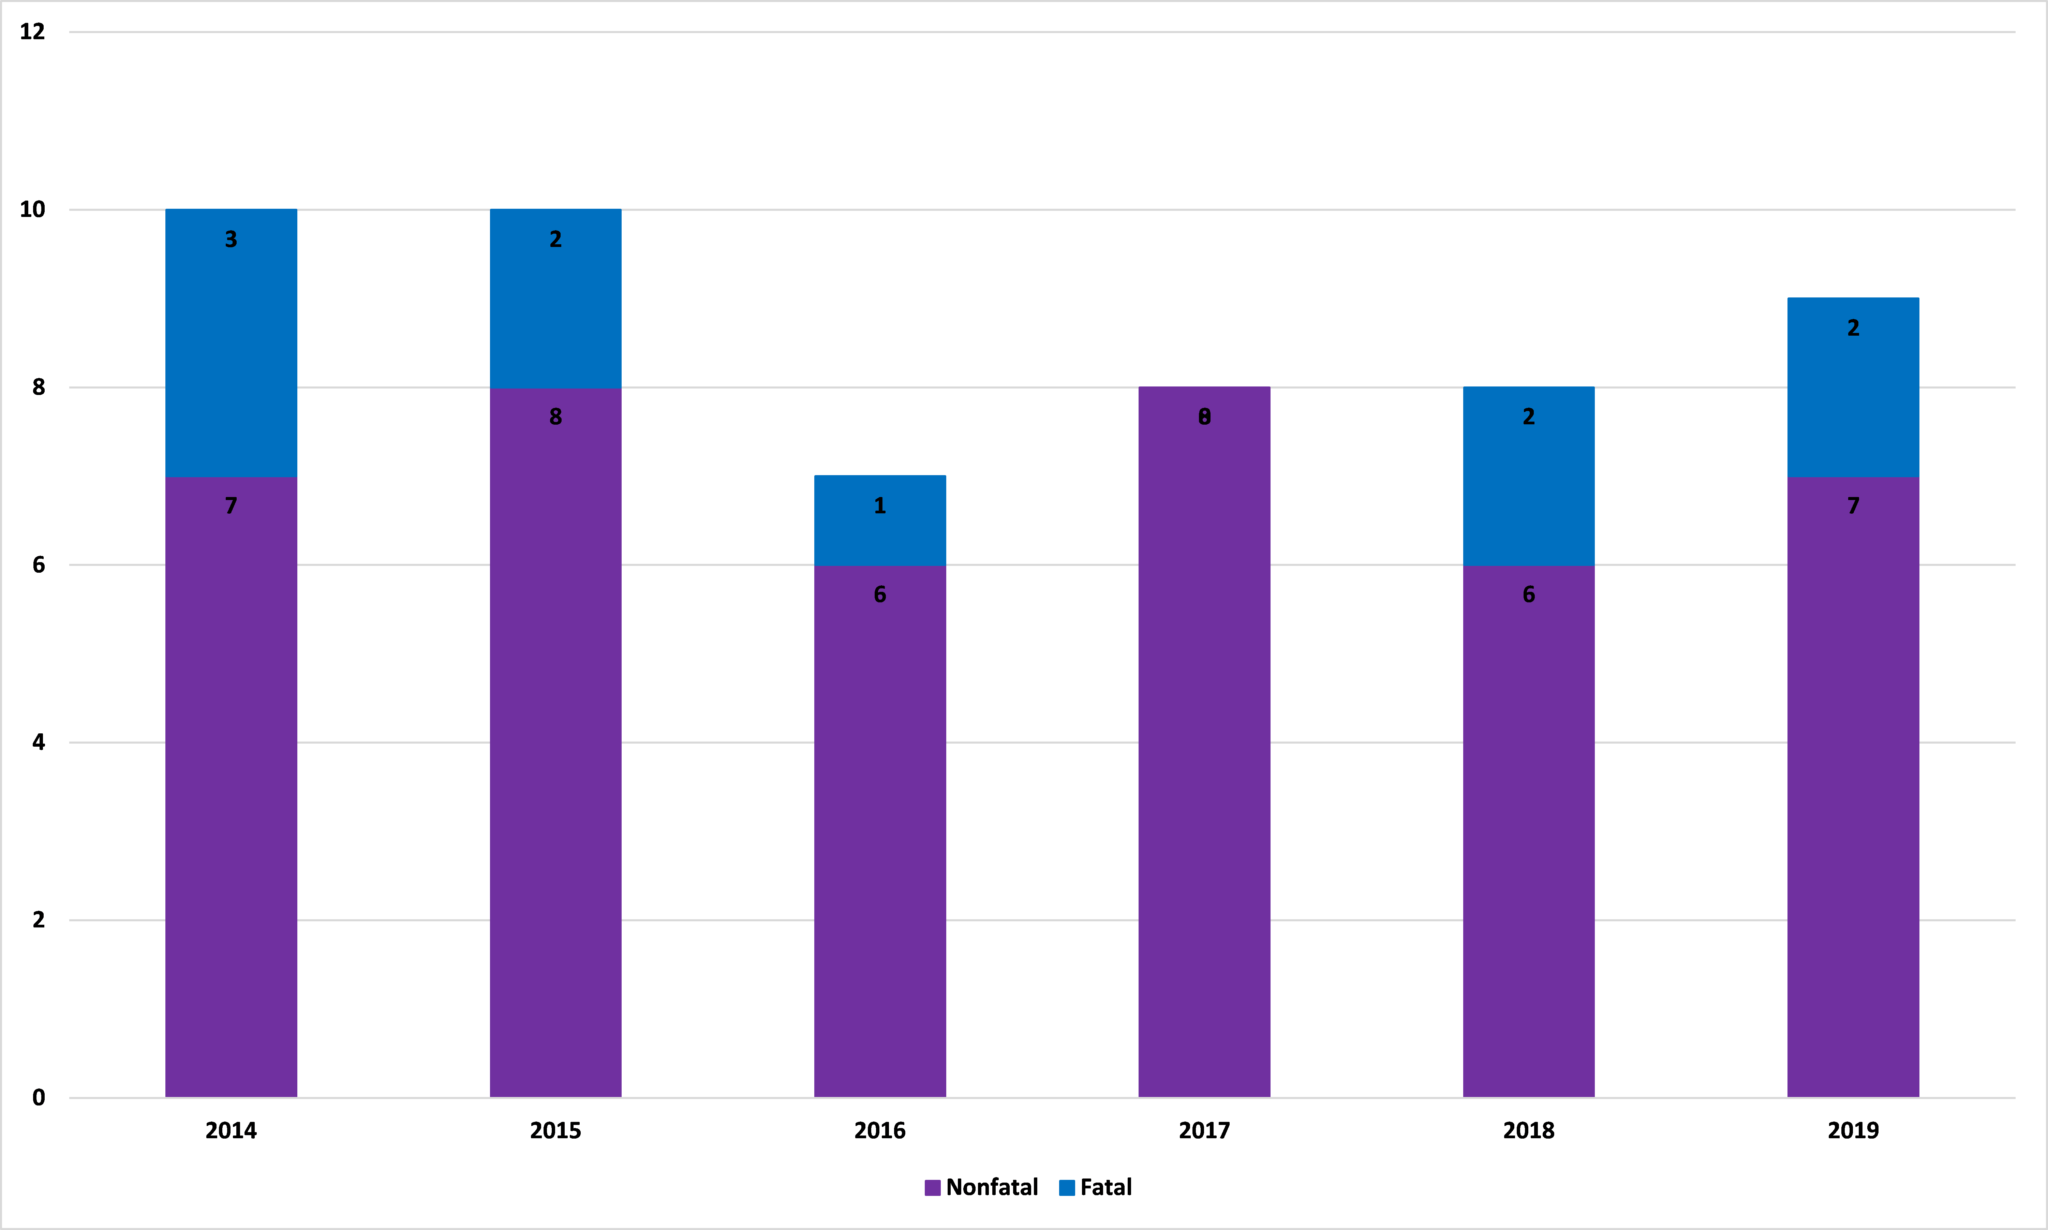
Source: MPR News
Trains are less safe
Sadly, this isn’t a glitch but a feature of the system. As we wrote in our 2017 report ‘Twin Cities Traffic Congestion: It’s No Accident‘,
In 1967, automobile accidents killed 53.5 people for every billion vehicle miles of travel. By 2015, safer vehicles and safer roads had reduced this to 11.3 fatalities per billion vehicle miles. Urban roads have always been safer than rural roads, with fatalities in urban areas declining from 36.2 per billion miles in 1967 to 7.1 in 2015. At an average occupancy rate of 1.67 people per vehicle, that’s 4.3 fatalities per billion passenger miles. Minnesota has significantly lower fatality rates than the national average, suffering just 4.0 urban fatalities per billion vehicle miles (2.4 per billion passenger miles) in 2015. Minnesota urban freeways are the safest of all, seeing just 1.6 fatalities per billion vehicle miles or less than one fatality per billion passenger miles.
By comparison, transit is no safer than cars today, and some forms of transit, in particular light rail and commuter rail, are far more dangerous. Because transit vehicles are so much bigger than other vehicles, they are fairly safe for people on board, but can be deadly to pedestrians, bikers, and automobile occupants.
While figures are not available for Minnesota, nationally transit buses killed an average of 4.0 people for every billion passenger miles they carried in 2014, the latest year for which data are available. That makes buses about as safe as automobiles. Commuter rail, however, did much worse at 7.3 fatalities per billion passenger miles. Light rail is the deadliest of all, at 15.7 fatalities per billion passenger miles. The numbers vary from year to year, but—unlike automobiles—transit is not getting much safer over time. The average over the past 10 years was 4.3 fatalities for buses, 8.8 for commuter rail, and 13.9 for light rail.
Metro Transit: The most dangerous LRT system in America
Even worse, the Twin Cities light rail performs especially badly. As Kevin Terrell wrote in January,
Metro Transit’s Light Rail Transit (LRT) system is the least safe system of any of its self-selected peer transit systems.
For instance, as the attached charts show, Metro Transit’s multi-billion dollar light rail (LRT) system has by far the overall worst safety record of any of its (self-selected) peer systems.
Drill down into the NTD data, and since the launch of the system’s second LRT service (the Green Line) in 2014, Metro Transit LRT has had the most collisions, the most safety events, and the most injuries per million train miles of any of its peer transit systems across the country. The only one out of four safety factors in which Metro Transit LRT is not in last place, is fatalities per million train miles – with a less than stellar 7th place finish out of 10 systems.
John Phelan is an economist at the Center of the American Experiment.