Minnesota’s Workforce to 2050
Today, we release our report Minnesota’s Workforce to 2050. In it, we explain why high levels of employment are particularly important to Minnesota; how those high employment ratios are set to decline in years to come; what has been driving those declines this century; and what state policymakers can do to alleviate these pressures.
Why employment matters
Our state has above average levels of GDP per capita. But, as we explained in our report The State of Minnesota’s Economy: 2018, this is based on its high employment ratio. There greater the share of the population working to produce GDP, the more GDP there is to divide among the population. To see how much Minnesota’s favorable per capita rankings depend on its high employment ratio, consider how those per capita numbers would be different if the employment ratio changed. As Figure 1 illustrates, if Minnesota’s employment ratio in 2018 was the same as the national average—60.4%—then its ranking for per capita GDP would slip from 14th to 21st. GDP per capita would be $4,691 (or 7.1%) lower. Indeed, without a high employment ratio to mask below average labor productivity, Minnesota would now lag the national average on this measure.
Figure 1: Gross Domestic Product per capita, 2018, if Minnesota had the U.S. average employment to population ratio (2018 dollars)
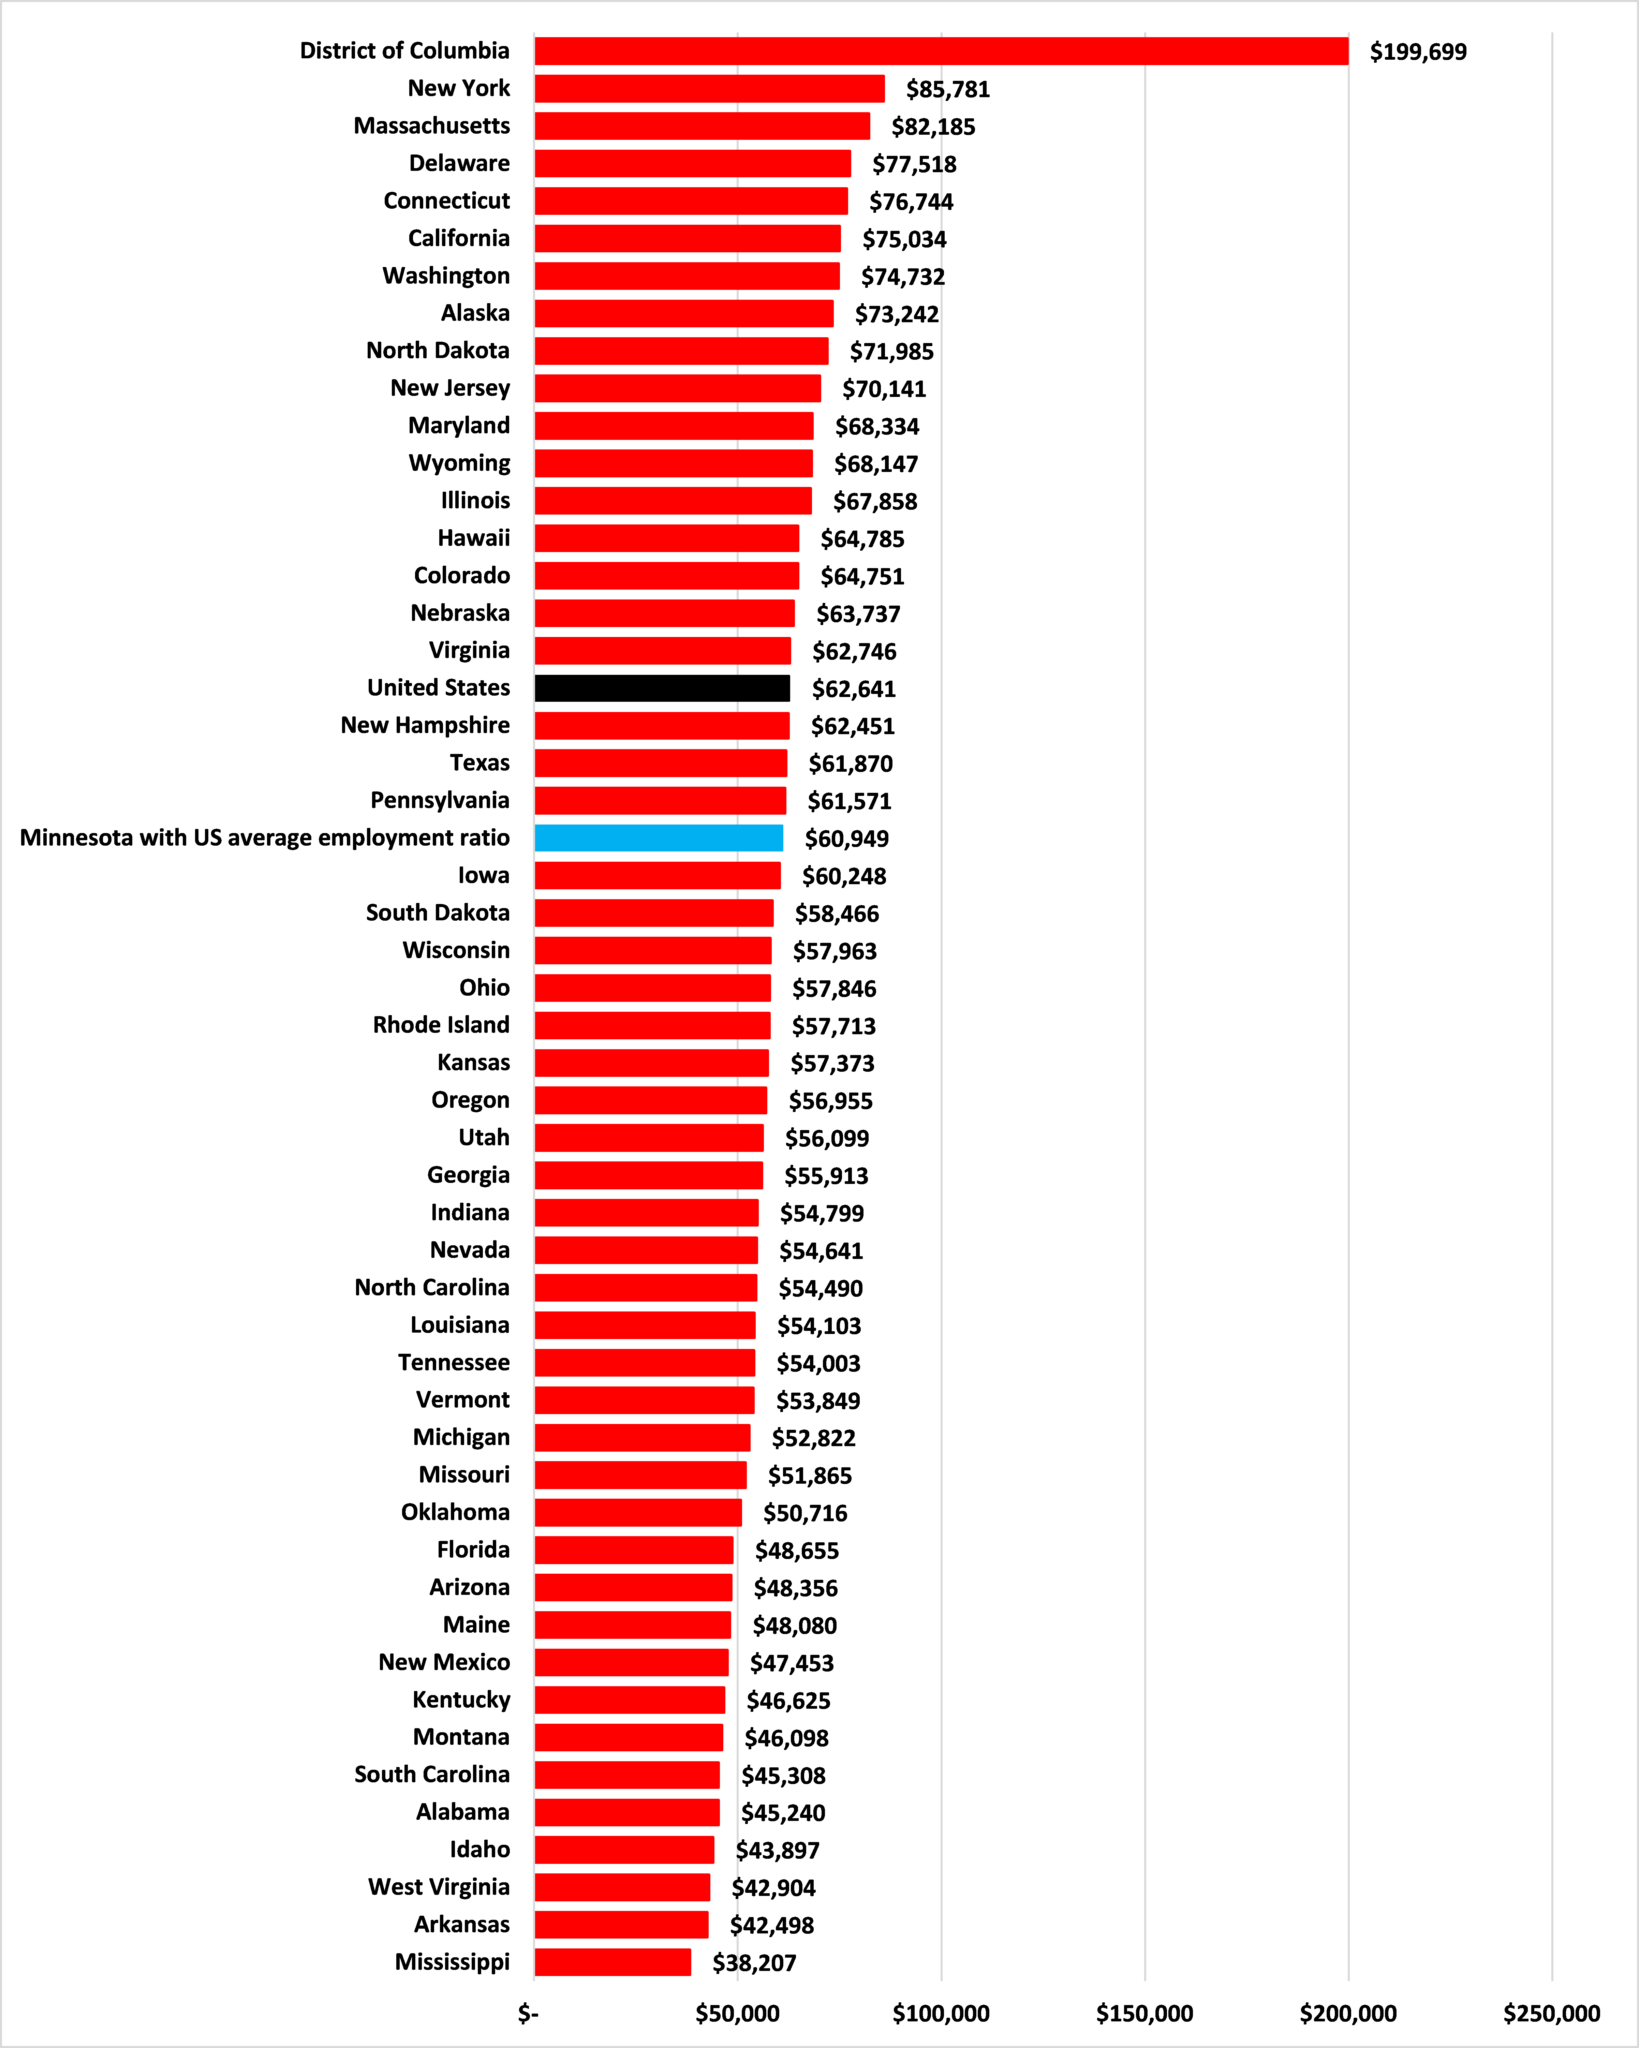
Source: Center of the American Experiment
Minnesota’s above average per capita incomes are not driven by the productivity of its workforce. When it comes to labor productivity, Minnesota is below the national average. Looking at GDP per worker, our state performs worse than the nation as a whole. The average Minnesota worker produced $123,348 of GDP in 2018, ranking 20th, compared to $131,571 for the average U.S. worker, 6.7% higher. If we look at output by the number of hours worked, we see that in 2018 GDP per hour worked in the private sector was $70.39 in Minnesota, 5.9% lower than the figure of $74.80 for the U.S. And, as economists agree, in the medium to long term it is productivity which drives incomes.
Given the importance of a high employment ratio to the state’s above average incomes, forecasts of the decline in Labor Force Participation rates and employment ratios ought to be a source of particular concern for Minnesota.
What is the forecast for employment in Minnesota?
As Figure 2 shows, our state’s participation rate is forecast to fall from 69.7 percent in 2018 to 64.6 percent in 2035, lower than it has been at any time since at least 1976.
Figure 2: Minnesota’s Labor Force Participation rate, 1999-2050
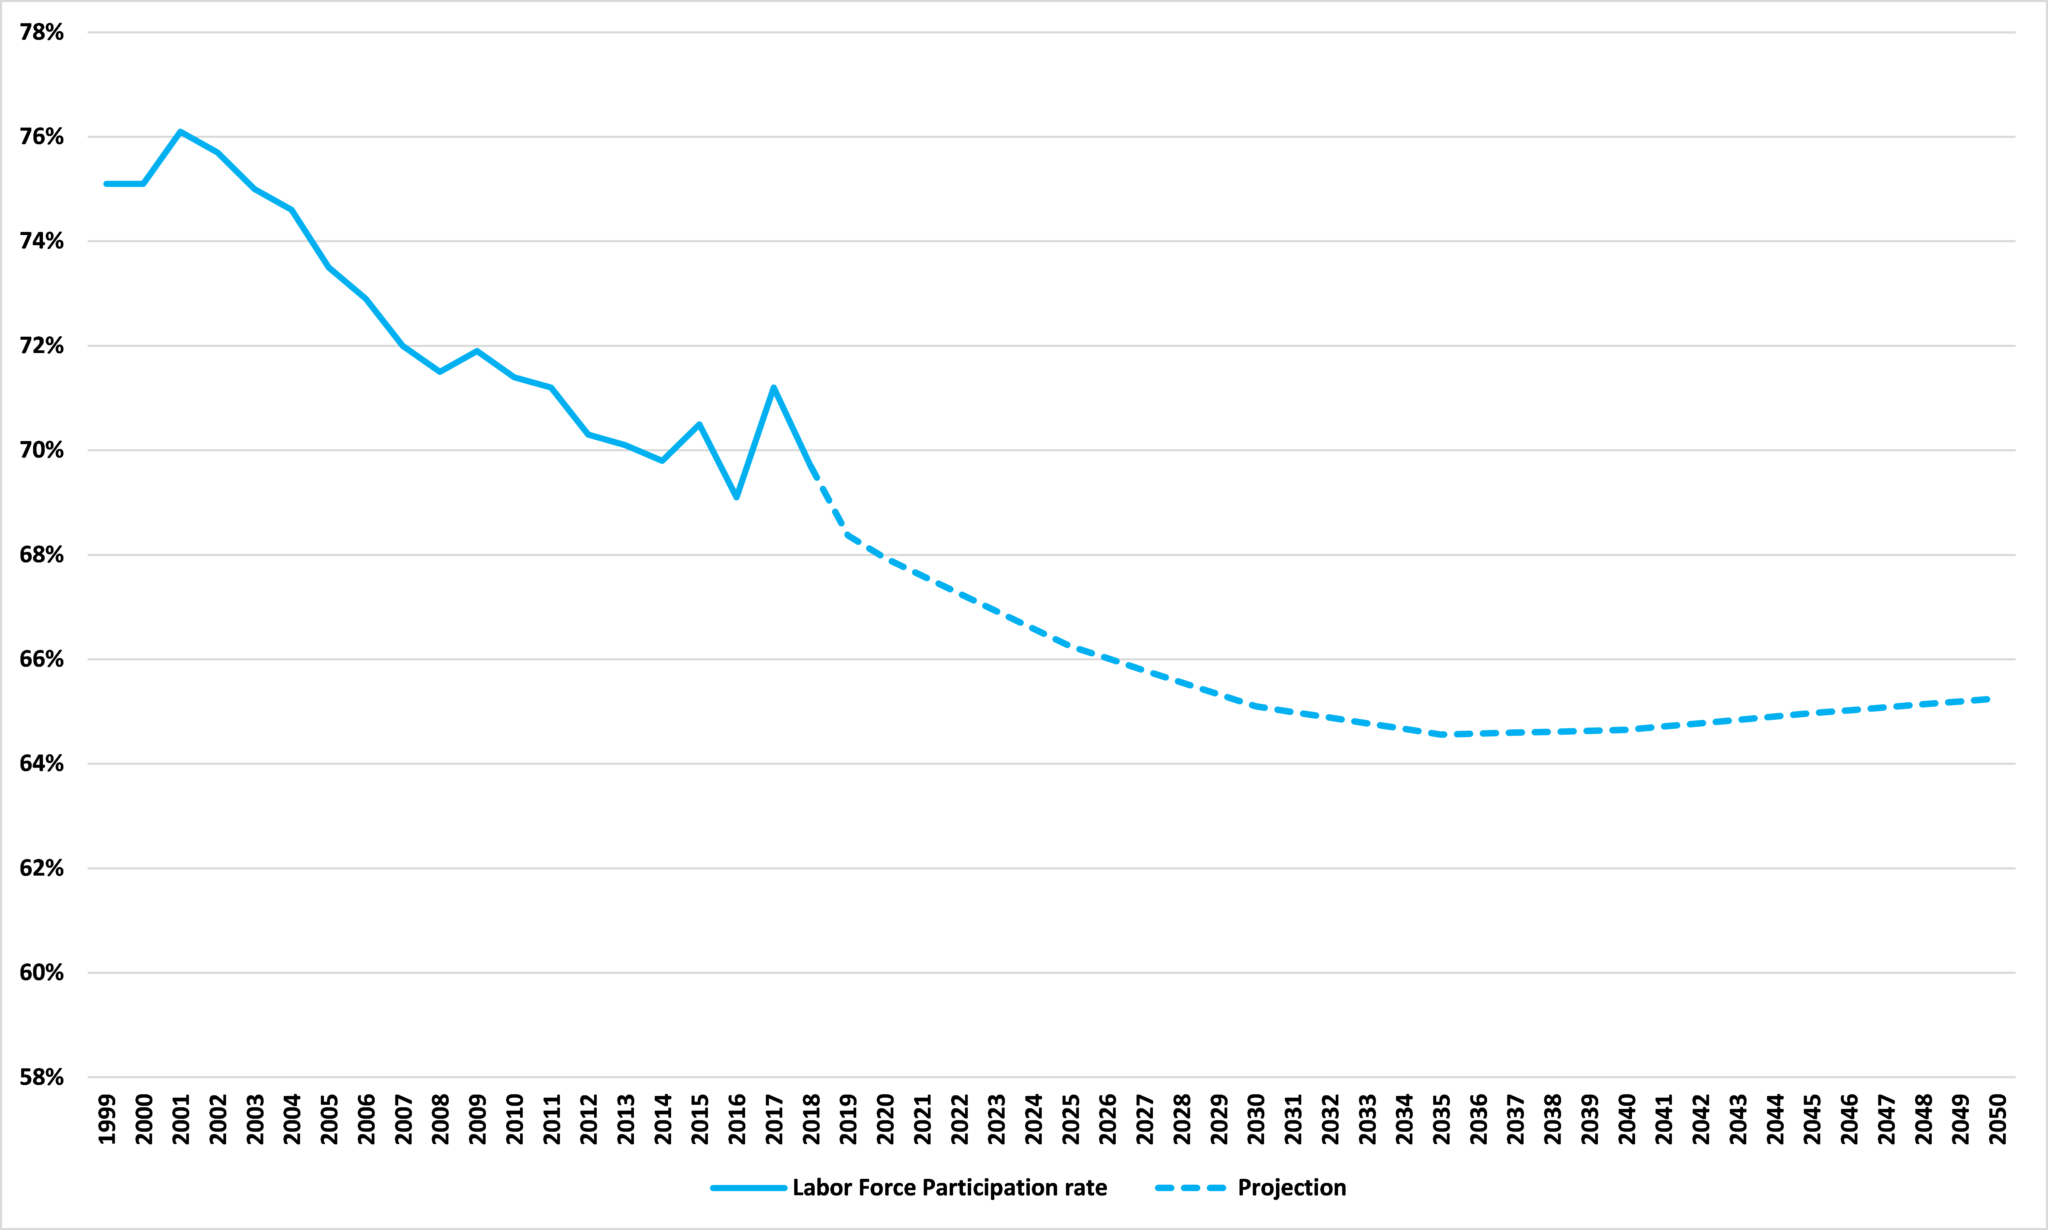
Source: Minnesota State Demographic Center
While this decline is commonly attrributed to the aging of the population – and this is an important driver – there are other factors at play. As Figure 3 shows, with the exception of 35 to 44 year olds, the participation rate of all age groups from 25 to 75 is forecast to increase between 2020 and 2045. Indeed, the largest increase in the participation rate will be seen among those aged 62 to 64, while the steepest decline is forecast to be among those aged 16 to 19.
Figure 3: Change in Minnesota’s Labor Force Participation rates, 2020-2045, percentage points
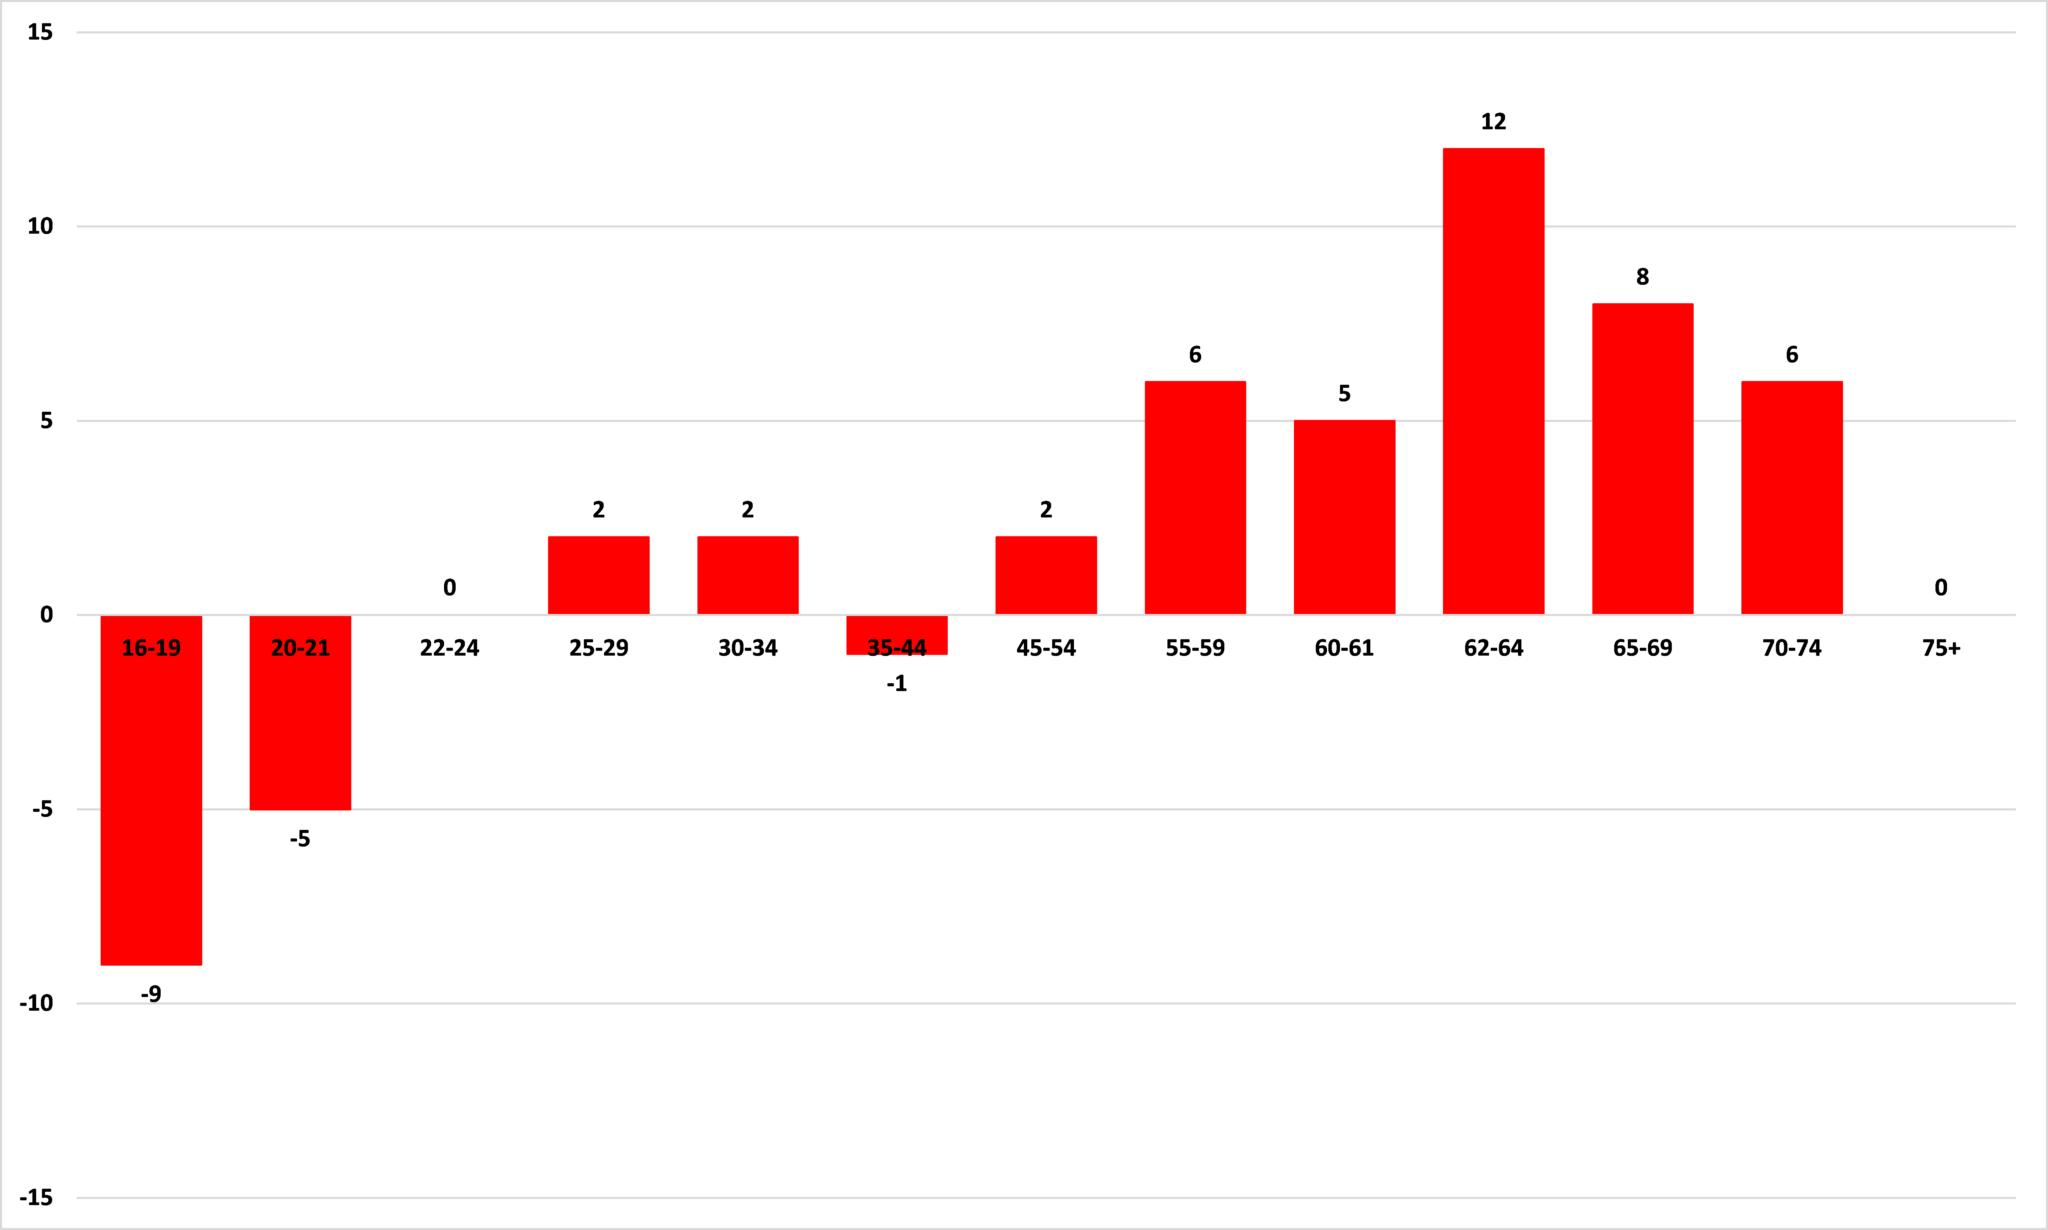
Source: Minnesota State Demographic Center
These projections seem reasonable enough given recent labor market trends. Figure 4 shows categories where employment ratios have increased in Minnesota between 2000 and 2018. They include all workers, male and female, over the age of 55, and for women aged 25 to 34 and men aged 45 to 54. Compared with the same categories nationwide, Minnesota performed particularly well in the 55 to 64 category but less well among those over 65.
Figure 4: Percentage point changes in employment ratios, 2000-2018
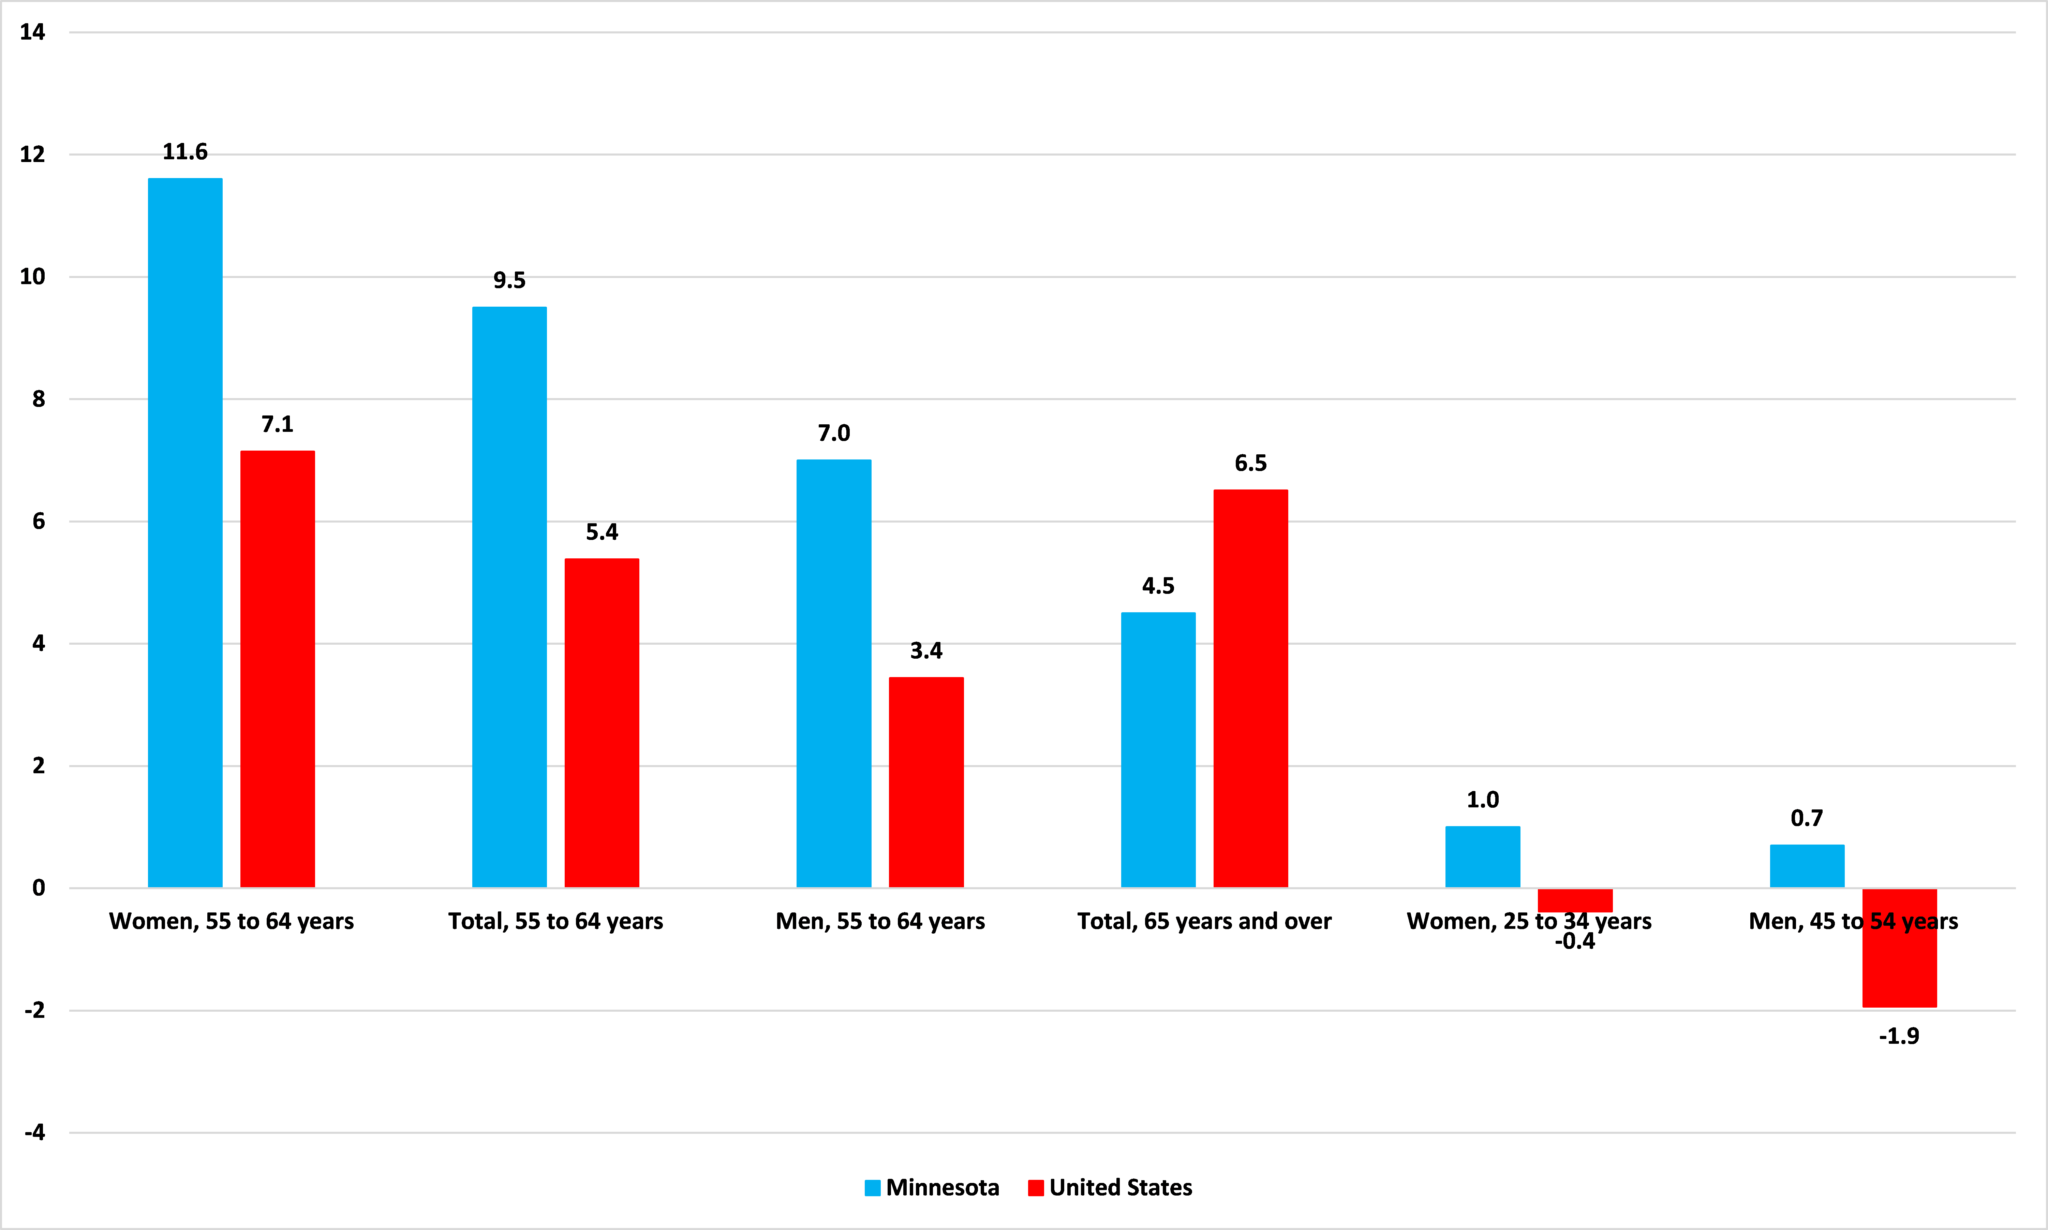
Source: Bureau of Labor Statistics
Figure 4 shows the categories where employment ratios decreased in Minnesota between 2000 and 2018. We see that, overall, the steepest falls in employment ratios have been among younger Minnesotans. The largest decline has been among those aged 16 to 19 years. The next two largest falls are found among male and female Minnesotans, aged 20 to 24. The story is broadly similar nationally, with the larger declines being found among younger workers, especially young men. But Minnesota has underperformed the national average by some margin in some of these categories, particularly in the 20 to 24 category. On youth employment, this century Minnesota has performed poorly compared to the U.S. generally. In fact, in 15 of the 24 categories in Figures 4 and 5, Minnesota has performed worse than the U.S. average.
Figure 5: Percentage point changes in employment ratios, 2000-2018
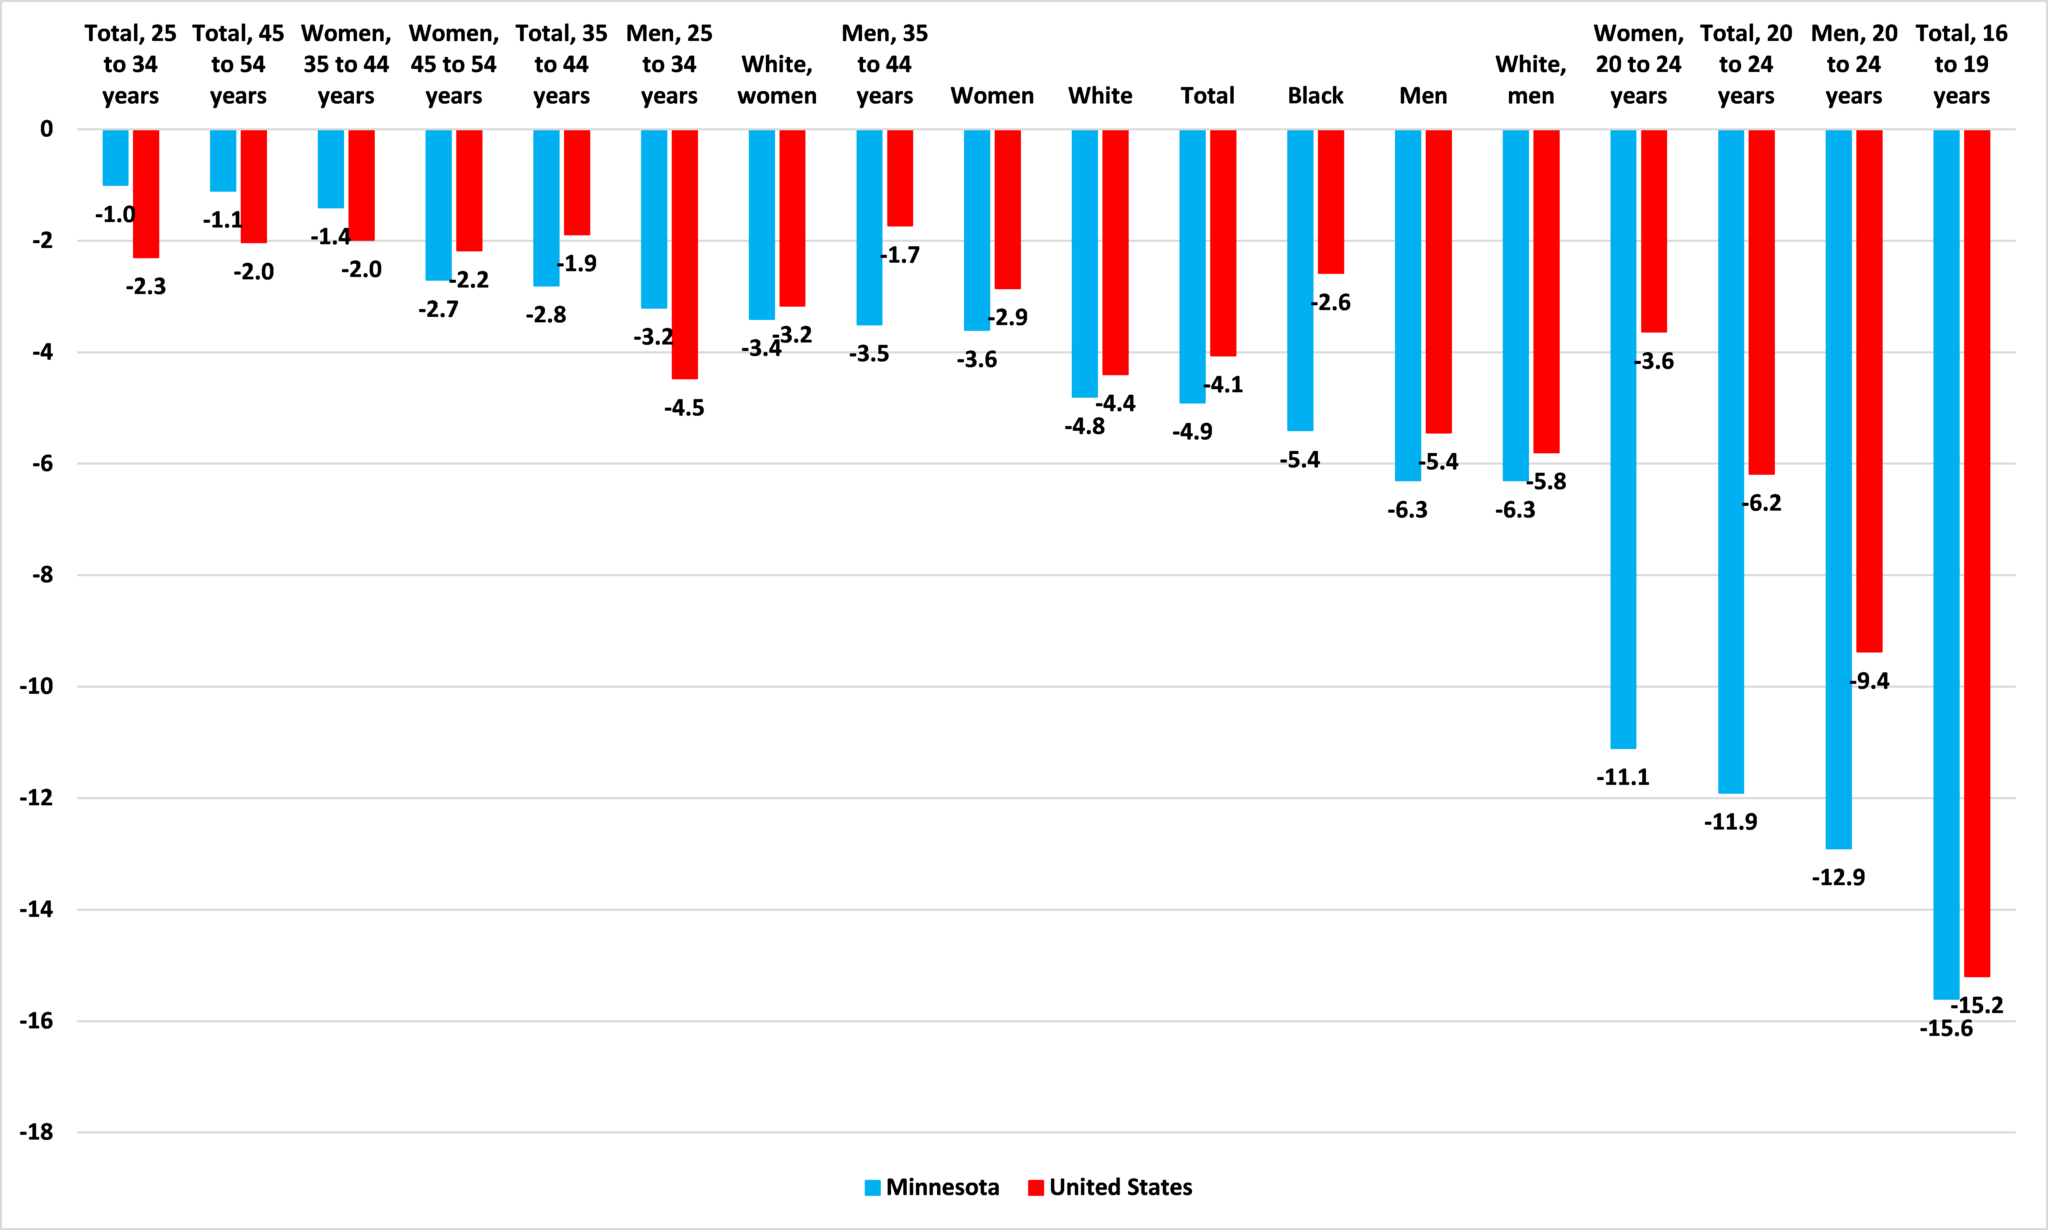
Source: Bureau of Labor Statistics
What is driving these trends and what can policymakers do?
While the aging of the population and falls in employment resulting from that might be something policymakers can do little about, there is no reason that declines in employment in younger sections of the population cannot be reversed. This will go at least some way towards offsetting the forecast labor force decline and maintaining Minnesota’s high employment ratio.
Table 1 summarizes the results of academic research into Labor Force declines seen in the U.S. in recent decades. Major contributing factors are expanded trade and the adoption of industrial robots. Significant contributing factors are increased disability benefits (SSDI, VADC), higher minimum wages, increased rates of incarceration, and the rise in occupational licensing.
Table 1: Factors contributing to the decline in employment-to-population ratio from 1999-2016
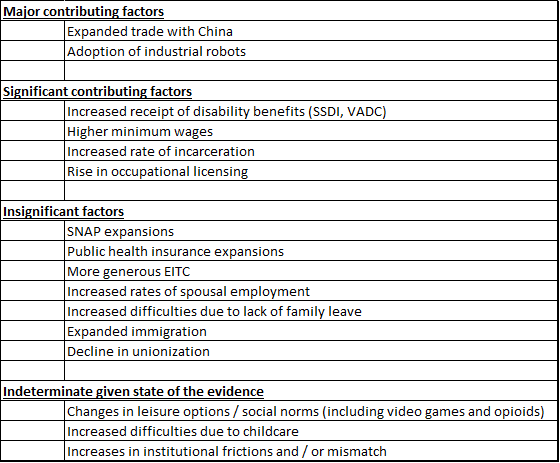
Source: Abraham and Kearney, 2018 and Center of the American Experiment
Looking at how these factors relate to Minnesota, we find that our state has shielded manufacturing workers from the full impact of the “China Shock” with uncharacteristically low tax rates on capital intensive manufacturers— we rank 2nd lowest nationally.Increased exposure to technology lowers female participation rates, which have fallen in Minnesota more than nationally since 2000. The state has, so far, had only average exposure to industrial robots, but research suggests it could be of “upper medium vulnerability” to job losses in the future.
Among significant factors, receipt of Social Security Disability Insurance (SSDI) has increased in Minnesota has increased in recent years, but still lags the nation. Our state leads the national average on Veterans Affairs Disability Compensation (VADC) recipients as a share of the population, but these recipients typically receive lower payouts than the average. This might suggest that increased receipt of these benefits has played little part in Minnesota’s declining employment ratio. But research shows—strongly in the case of SSDI—that these increases have lowered employment at the margin. The same is likely to be true also for state programs. Research has also found that increased use of these benefits has reflected policy choices rather than increased clinical need.
Higher minimum wages have been shown to have a negative impact on teen employment particularly. Minnesota’s minimum wage, which is above the federal rate, can reasonably be blamed for at least some of the above average decline in teen employment seen in the state.
Minnesota’s incarceration rate is one of the lowest in the country, but disparities between rates for white and black residents are 4th highest nationally. Research shows that this has a disproportionate negative impact on rates of black employment, so this could explain at least some of the greater decline in employment among black Minnesotans than nationally.
Occupational licenses have been found to lower the labor supply of white workers especially. At present, Minnesota’s occupational licensing burden is not especially onerous. However, research shows that, between 2012 and 2017, our burden rose at the 11th fastest rate in the country, which could partially explain a greater decline in white employment ratios in Minnesota than nationally.
Figure 6 summarizes the policies – explained in more depth in the paper – which state policymakers ought to adopt to address some of these factors.
Figure 6: What can be done for employment in Minnesota?
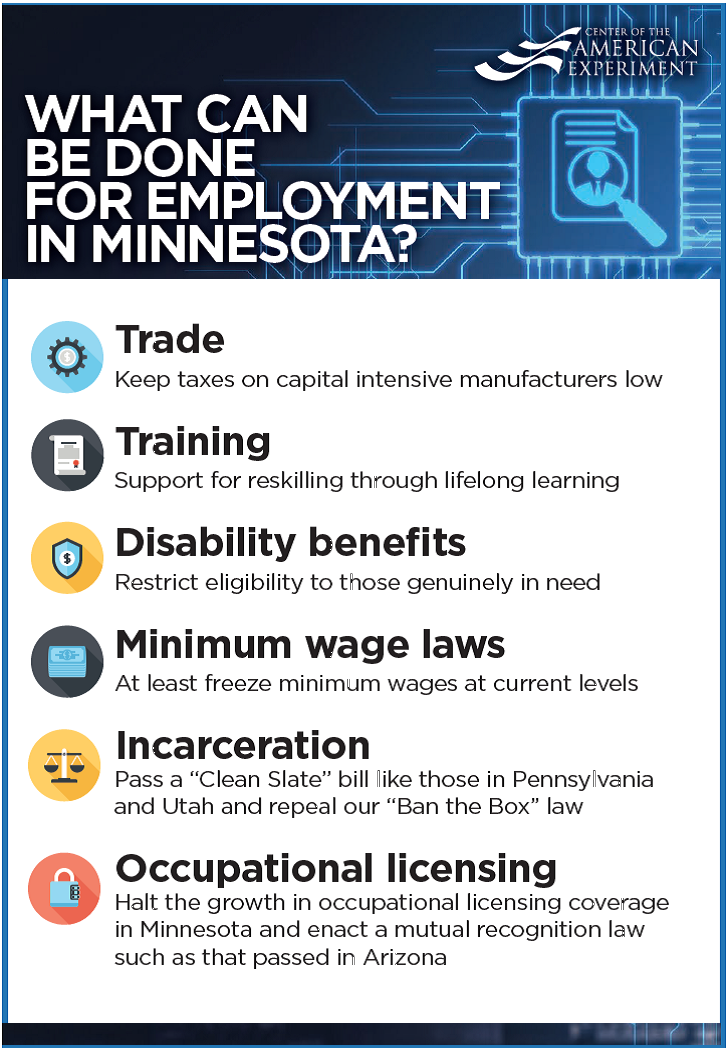
Source: Center of the American Experiment
John Phelan is an economist at the Center of the American Experiment.