How the Fires Affected Air Quality in Minneapolis
The killing of George Floyd by a former Minneapolis police officer sparked massive, peaceful demonstrations where people aired legitimate grievances about the use of force by officers. It also resulted in riots, looting, and arson. The fires that were set in the wake of the killing destroyed numerous businesses, including many of the businesses I used to frequent when I lived in the Longfellow neighborhood in Minneapolis. They also caused a significant spike in air pollution in the area.

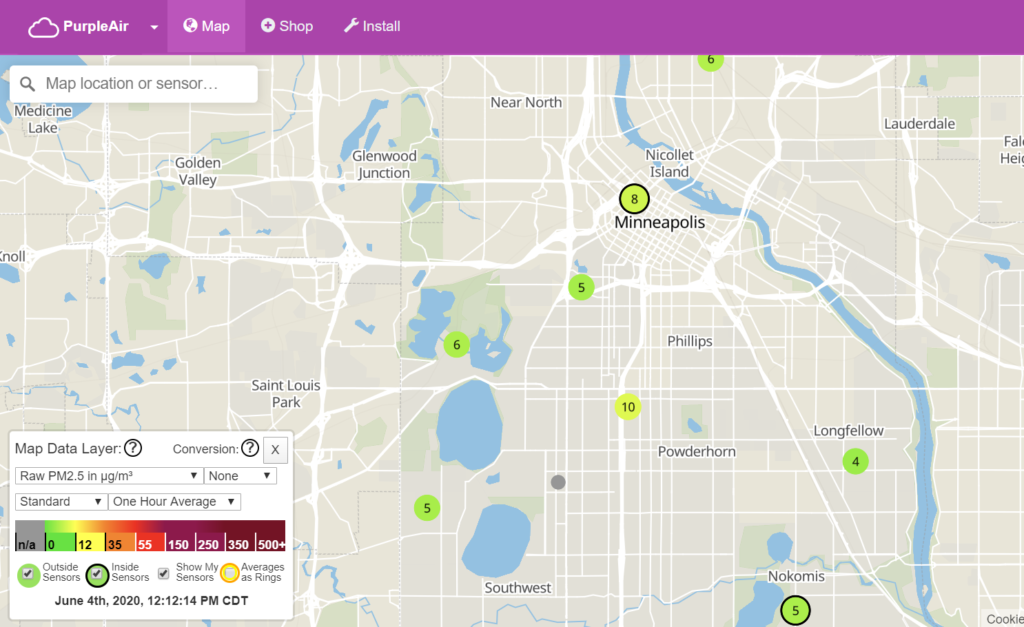
A website called PurpleAir shows air monitoring data for several stations throughout the City of Minneapolis. PurpleAir appears to be a company that sells air quality monitoring devices, and these devices use WIFI to upload the air quality to their website in real time.
I will caution that I am not aware of how accurate these air monitoring devices are, but I believe they are unlikely to to be as accurate as the network of air monitoring stations administered by the U.S. Environmental Protection Agency or the Minnesota Pollution Control Agency, or meet the methodology established by the National Institute for Occupational Safety and Health (NIOSH) for air monitors. Nonetheless, the data are interesting to look at.
The map below shows areas where PurpleAir has air sensors. For this post, we’ll be looking at the sensor with the number 10, just northwest of Powderhorn Park.
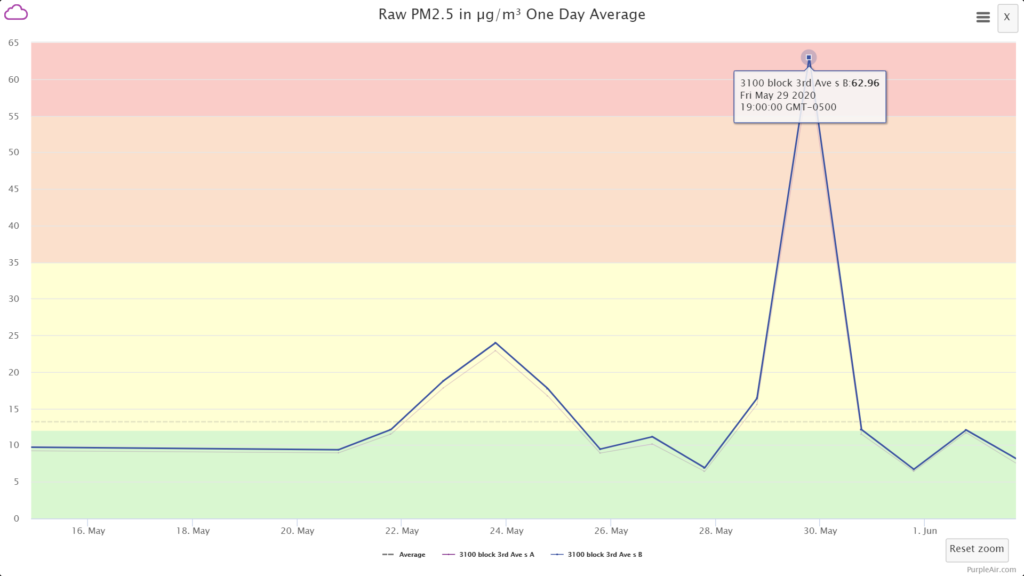
The graph below shows the concentration of fine particulates in the air, called PM2.5. It is called PM2.5 because the particles measure 2.5 microns in size. For context, a human hair is generally 50 to 70 microns in diameter, meaning these particles are at least 20 times smaller in diameter.
As you can see, the concentration of these fine particles had a peak daily average concentration of 62.96 per cubic meter (ug/m3), which exceeds the EPA’s 24-hour standard of 35 ug/m3 by a large margin.
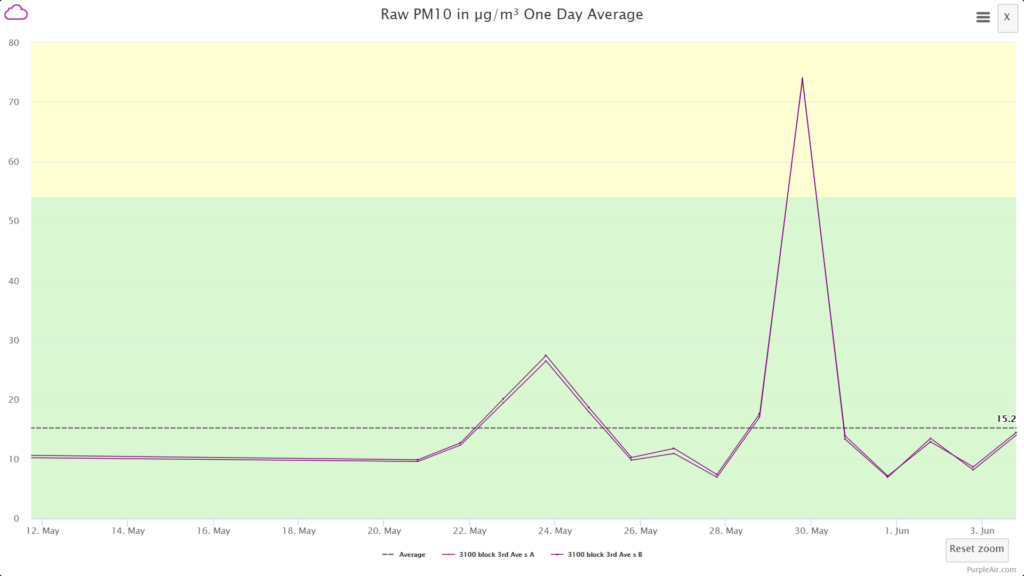
 PM10 (particles measuring 10 microns in diameter) measurements were also elevated, but to a lesser extent than finer particles. On May 30th the average concentration for PM10 was 73.7 ug/m3, which is below the 150 ug/m3 standard.
The hourly data show higher concentrations of both PM2.5 and PM10. The graph below shows hourly PM2.5 concentrations hit a high of 357.74 ug/m3. EPA does not have hourly standards for these pollutants, but as you can see, the concentrations of PM2.5 were about 10 times higher than the 24 hour standard for this monitoring station on May 30, 2020.
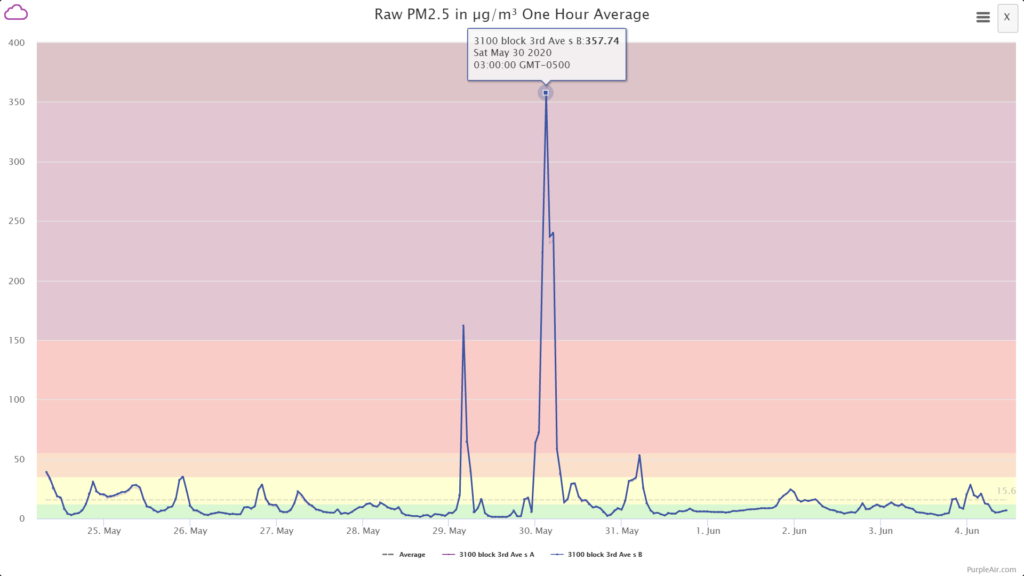
Peak hourly PM10 concentrations on May 30, 2020 were 442 ug/m3, or about three times higher than the 24 hour standards.
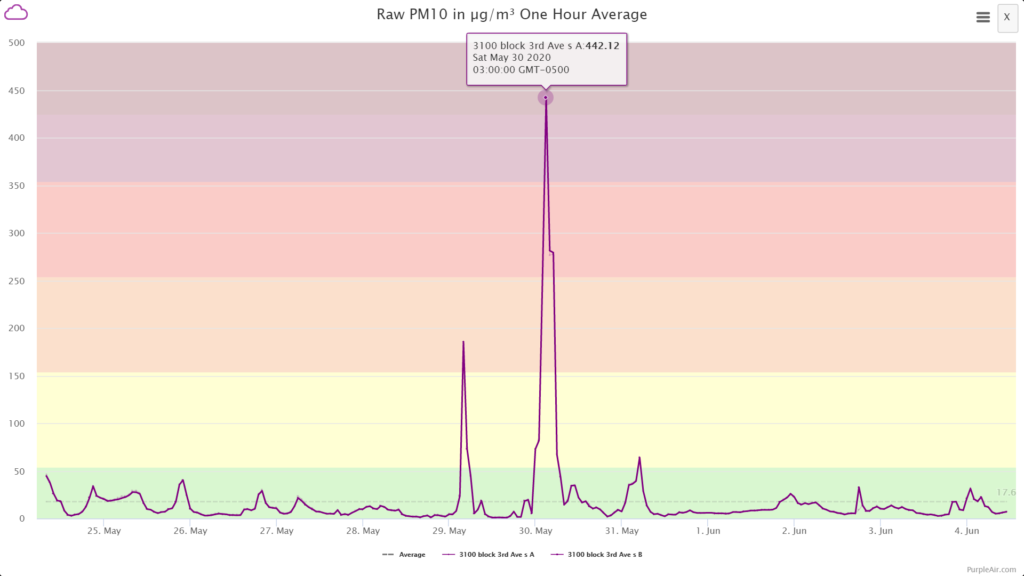
The data show the impact of the fires on air quality was short-lived, with air quality returning to background concentrations by May 31, 2020, but the data also show the fires caused by-far the largest spikes in air pollution that have been observed over the last year.