Minnesota’s Budget Deficit: State government spending is already historically high
On Tuesday, Minnesota Management and Budget forecast a surplus of $641 million for the FY 2020-21, which ends next June, but a deficit of $1.273 billion for FY 2022-23. This next biennium is the main job of the upcoming 2021 session. As we explained on Monday when we launched our new paper Minnesota’s Budget Deficit: Why we should make spending cuts and not raise taxes, the state constitution requires a balanced budget each biennium. Lawmakers in St. Paul must ask themselves the question: how will we close this deficit? They will have three options: higher tax rates, lower spending, or some combination of both.
The facts we have already reviewed should steer us toward relying on spending cuts to achieve fiscal consolidation: Minnesota’s tax rates are already some of the highest in the United States; tax revenues are driven by economic growth, not hikes in tax rates; tax hikes have been shown to retard economic growth. And there is plenty of scope for cuts to Minnesota’s state budget.
State government spending is already historically high
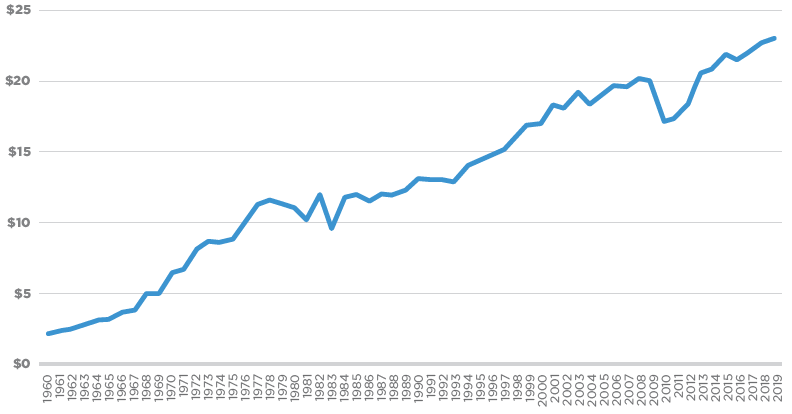
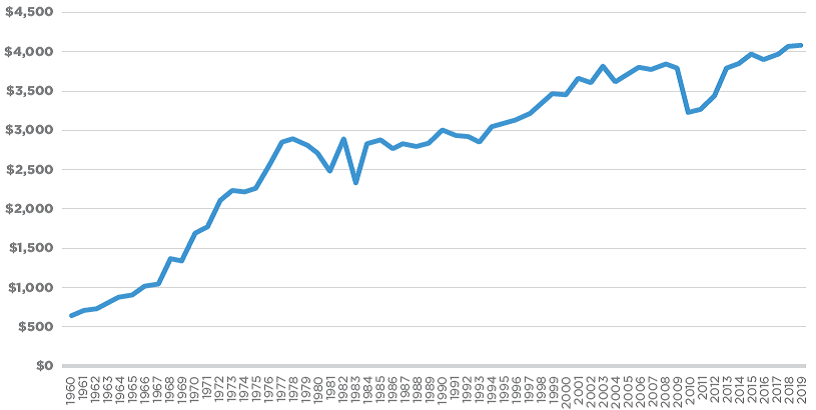
As Figure 1 shows, Minnesota’s General Fund spending was higher in real, inflation adjusted terms in 2019 than in any previous year. Of course, our state’s population has risen over this period, but even accounting for that, as we do in Figure 2, we see that in per person, real terms, Minnesota’s state government has never spent more money than it is right now: $4,088 per Minnesotan, up 26.6 percent since 2010.
Figure 1: Total General Fund spending, 1960 to 2019 (billions 2019 USD)
Source: Minnesota Management and Budget
Figure 2: Per capita General fund spending, 1960 to 2019 (2019 USD)
Source: Minnesota Management and Budget
The two main areas of state government spending in Minnesota are education and welfare. Together, they accounted for 75.0 percent of state government spending in 2018.
Education spending
Every year between 2010 and 2018, spending on education has amounted to more than 35 percent of General Fund spending. Education spending grew over this period by 21.3 percent in real terms, the seventh highest rate among the states. But even after this, Minnesota’s per pupil spending in 2018 amounted to $12,974 per pupil, only slightly above the national level of $12,612.
Welfare spending
Welfare spending is the second biggest category. Every year between 2010 and 2018, spending on welfare has amounted to more than 30 percent of General Fund spending. Spending on welfare includes monies spent on assistance programs targeted toward low-income individuals and spending on Medicare and Medicaid, which make up a majority of public welfare spending.
In 2018, Minnesota’s state government spent $30,479 in public welfare for each person in poverty. This compares to a national average of $17,127 and ranks our state third nationally for
welfare spending, as Figure 7 shows. Only Massachusetts and Alaska spent more in welfare per person in poverty than Minnesota in 2018.
Figure 3: Welfare spending per person in poverty, 2018 USD
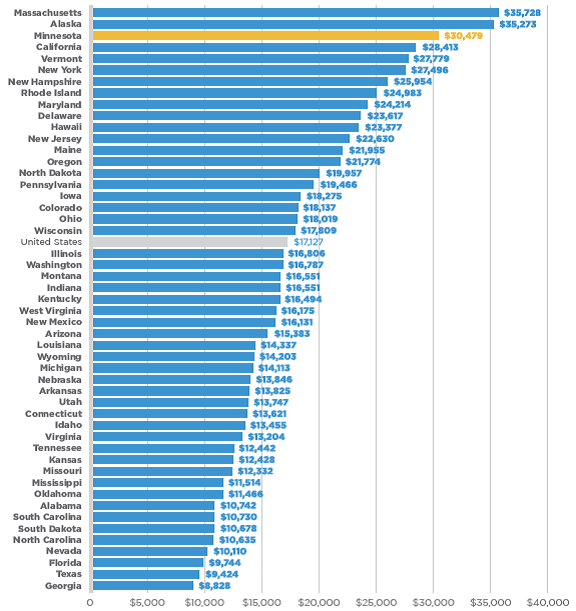
Source: Census Bureau
Indeed, Minnesota’s welfare spending is so high compared to other states that if its state government spent the national average per person in poverty—$17,127—it would have spent only $9.0 billion in 2018, which is $7.1 billion less than the $16.1 billion it actually spent. If Minnesota closed its deficit by cutting welfare spending by $2.4 billion, the amount of welfare we spend per person in poverty would still rank us sixth highest in the United States.
John Phelan and Martha Njolomole are economists at the Center of the American Experiment.