The high cost of the Virginia Clean Economy Act
Center of the American Experiment analyzed Virginia’s compliance with the Virginia Clean Economy Act (VCEA) legislation passed in 2020. This analysis models the cost of meeting the renewable energy mandates established by the VCEA and analyzes its impact on the electric grid’s reliability. Our study examines two scenarios.
One scenario, called the VCEA scenario, examines the cost and reliability impacts of fully meeting electricity demand in Virginia using a combination of the state’s existing nuclear power plants and new offshore wind, onshore wind, solar, and battery storage technology by 2050.
The other scenario, called the Reliable Resource Scenario (RRS), focuses on maintaining existing nuclear, natural gas, and coal-fired power plants to optimize affordability and reliability. It also adds natural gas generation capacity to reduce the need for electricity imports from other states.
We conclude that complying with VCEA energy mandates will make maintaining a reliable electricity grid exponentially more difficult and expensive.
VCEA Scenario
Costs
The VCEA scenario would cost $203 billion through 2050 – much of which occurs after 2035. The legislation will increase the cost of electricity to an average annual expense of $1,770 per customer, with costs peaking at $3,500 per customer by 2045 (See Figure 1).
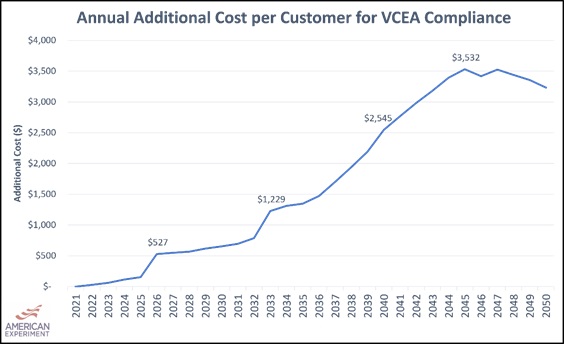
Figure 1. The VCEA will, on average, cost Virginians $1,770 per customer per year. Costs rise substantially as renewable energy requirements increase after 2035.
Residential ratepayers would see an average additional increase of over $1,160 per year. Costs would peak at more than $2,300 in 2045 (See Figure 2).
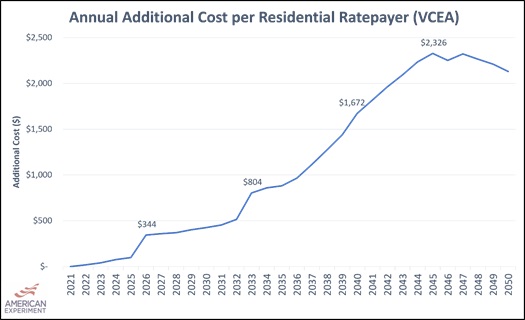
Figure 2. Residential electricity consumers in Virginia would see their electricity costs increase by an average of 1,160 per year, with costs reaching $2,300 per residential customer in 2045.
Businesses in Virginia would also see increased costs. Commercial and industrial rate classes would increase by an average additional expense of $6,800 (See Figure 3) and $218,000 per year (See Figure 4), respectively, while additional annual costs would reach as high as $13,700 and $437,000 by 2045.
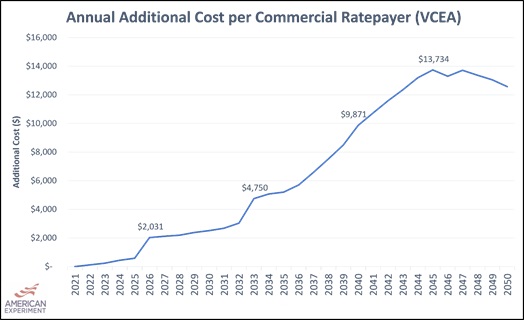
Figure 3. Commercial electricity users would see an annual average increase in their electricity expenses of $6,800. These costs would nearly double by 2045.
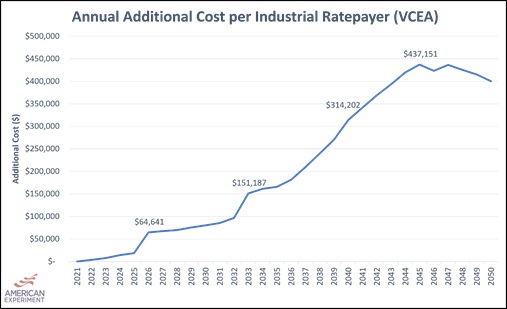
Figure 4. The additional annual cost per industrial ratepayer increases to as high as $437,000 in 2045.
The two largest sources of expenses consist of $99 billion in utility returns, and $84 billion in additional generation costs, while $13.2 billion in transmission expenses, $3.4 billion for nuclear upgrades, and $10 billion in property tax expenses are also included.
Under the VCEA, the amount of installed capacity on Virginia’s electric grid would increase from 26,300 MW in 2021 to 54,200 MW by 2035 and increase to 105,000 MW by 2050, representing a quadrupling of the amount of installed capacity on the Virginia electric system (See Figure 5).
While that may sound like a good thing, increasing capacity merely to meet renewable energy mandates rather than meeting demand is an unnecessary cost that will harm Virginia families and the state’s economy. Solar, onshore wind, offshore wind, and battery storage capacity grow the most, nuclear power remains constant, and coal and natural gas are phased out by 2050 to comply with the law.
Solar installations would grow the most under the VCEA, increasing from 956 MW of installed capacity in 2020 to 51,100 MW of capacity in 2050. Onshore wind capacity would grow from zero MW in 2020 to 7,500 MW in 2050, offshore wind would grow from 12 MW in 2020 to 5,200 MW in 2050, and battery storage would increase from zero MW in 2020 to 33,500 MW in 2050.[1]
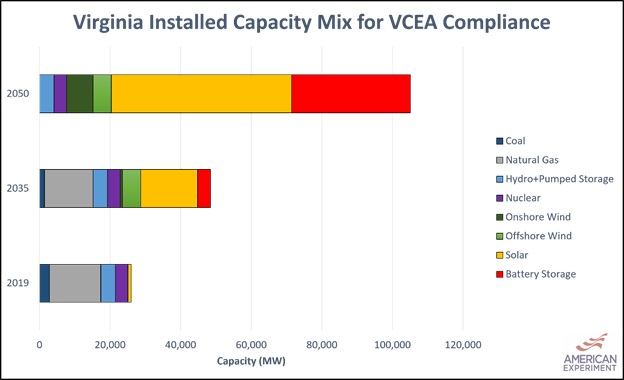
Figure 5. Capacity installations in Virginia grow significantly to comply with VCEA, reaching 105,000 MW in 2050.
It is important to note that our model selected these solar, onshore wind, and battery storage resources because they were the most cost-effective portfolio for meeting the renewable energy mandates enacted by the VCEA and maintaining grid reliability.
SIDEBAR: Constructing additional offshore wind installations beyond the 5,200 MW of capacity that was determined to be in the public interest under the VCEA would have increased the cost of compliance. For example, doubling installed offshore wind capacity to 10,400 MW, while modestly reducing solar capacity, would have increased the total cost of VCEA compliance $224 billion, a difference of $21 billion. Therefore, only 5,200 MW of offshore wind was built during our model run for the cost of the VCEA.
This model includes an extensive, 7,500 MW, buildout of onshore wind, which is beyond the scope of the 650 MW planned by Appalachian power. Our model selects onshore wind because it costs less than adding more offshore wind. For example, keeping the onshore wind at 650 MW and building more offshore wind would increase the cost of the model by $60 billion to $263 billion through 2050.
Building the solar panels, onshore and offshore wind turbines, and battery facilities under the VCEA would cost $39 billion, $13 billion, $20 billion, and $39 billion, respectively. Battery facilities are needed to comply with the VCEA because these facilities allow Virginia to meet the statutory requirement of the law, and to store excess electricity generated by solar, onshore wind, and offshore wind.
The Levelized Cost of Energy for Each Resource Type
The high cost of offshore wind facilities is showcased in the graph below, highlighting LCOE comparisons of existing power plants in Virginia and new wind and solar facilities.[2]
Data from the Federal Energy Regulatory Commission (FERC) show Virginia’s nuclear plants are some of the lowest-cost sources of electricity, generating power for $20 per MWh. Virginia’s natural gas plants generated electricity for $36 per MWh, and coal plants in the Commonwealth generated electricity for $81 per MWh, on average (Figure 6).
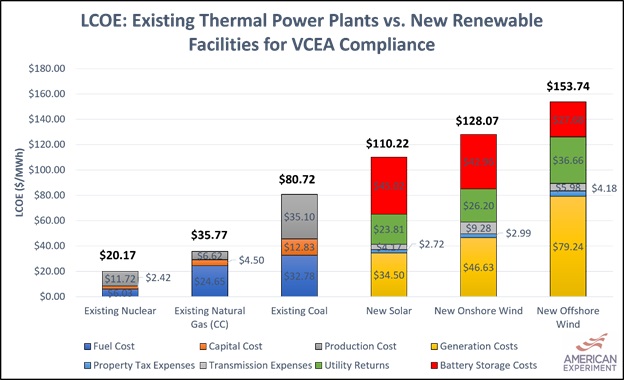
Figure 6. LCOE values for existing nuclear, natural gas and coal resources compared to LCOE values of the all-in cost of new wind and solar resources. When the often-hidden cost of operating an electric grid on intermittent energy sources are accounted for, new wind farms and solar fields are far more expensive.
Costs are higher for wind and solar facilities because, unlike traditional fossil fuel plants and nuclear plants, grids powered with large concentrations of intermittent wind and solar projects require much more transmission than dispatchable power systems.
These grids also require massive amounts of battery storage to provide reliable “backup” electricity when the wind is not blowing, or the sun is not shining. The cost of battery storage in the graph above can be thought of a levelized cost of intermittency, or unreliability. Furthermore, large quantities of batteries also require electric companies to build additional wind and solar installations to charge the batteries during windy and sunny periods for use at a later time.
Section V: Implications for Reliability
In addition to making electricity more expensive for Virginia families and businesses, the VCEA will also undermine the reliability of the Commonwealth’s electric grid by making it more reliant on weather-dependent energy sources, imports of electricity from neighboring states, and battery storage. In contrast, the RRS makes the Virginia grid more resilient over time.
After complying with the VCEA, Virginia’s electricity grid would not have sufficient dispatchable capacity available to reliably meet peak electricity demand and would be overly reliant on intermittent energy sources, such as wind and solar, and battery storage facilities that may or may not be there when Virginian’s need it most. (See Figure 7).
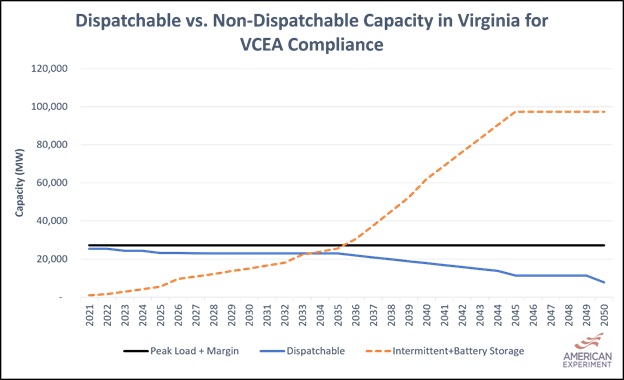
Figure 7. Dispatchable capacity in Virginia would fall from just over 25,000 MW to under 8,000 MW by 2050. Non-dispatchable capacity would increase from below 1,000 MW to more than 47,000 MW in 2050.
For example, based on hourly load forecast models, there are multiple 15+ hour time frames where the combined capacity of wind and solar – totaling nearly 64,000 MW in 2050 – produced at capacity factors below 10 percent. At times, the combined capacity factor hit zero.
In one of these instances, wind and solar produced at capacity factors below 10 percent for an 18-hour stretch, which came within a 64-hour period where the average capacity factor of combined wind and solar capacity was 11.6 percent and the highest it reached was 29 percent.
Furthermore, contributions from battery storage and import resources are not guaranteed. Battery storage additions required by our model are based on 2019 data to ensure the batteries are charged and ready for use during periods of low, or no, wind and solar generation.
Any future fluctuation from this 2019 generation or electricity demand dataset, which may cause wind and solar installations to produce less than 10 percent of their potential output, would potentially result in rolling blackouts or brownouts if electricity imports are not available to meet demand. To represent the fact that wind, solar, and battery storage energy sources may not be able to meet Virginia’s electricity needs, intermittent and battery storage resources are displayed in Figure 7 with a hatched line.
High Energy Costs Harm Virginia Families and the Economy
Under the VCEA, the additional cost per customer will reach as high as $3,500 in 2045. Low-income households will be hurt most by rising electricity costs because they spend a higher percentage of their income on energy bills than other Virginia households.
Data from the U.S. Department of Energy’s Low-Income Energy Assistance Data (LEAD) program show that many Virginia residents already spend between 6 and 8 percent of their income on energy (See Figure 8).[3]
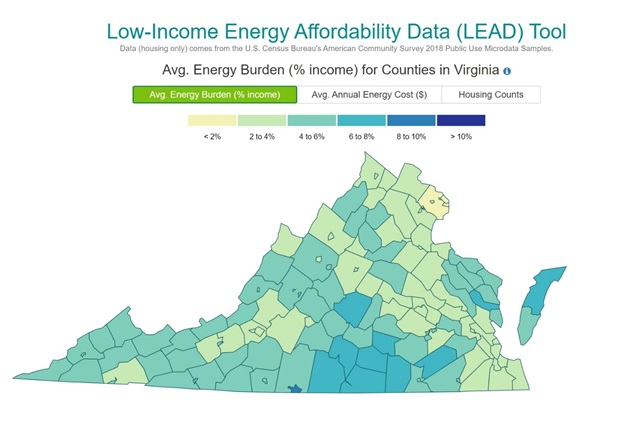
Figure 8. Federal data show Virginia households living in several counties already pay between 6 and 8 percent of their income for energy bills.
By increasing energy costs on Virginia consumers, the VCEA will increase the cost of essential services like refrigerating food and medicine, home heating, and air conditioning. As a result, the policy is incredibly regressive because those with the least will lose the most.
RRS
Generation Mix Under the RRS
Under the RRS, Virginia would continue to utilize the existing nuclear, coal, and natural gas power plants on its electric system, and Appalachian Power would continue to generate electricity at its West Virginia coal facilities for use in Virginia.
However, additional natural gas capacity would be built in Virginia to limit the state’s exposure to potential electricity shortages in other states if they become overly reliant upon intermittent wind and solar resources.
As a result, in 2050, Virginia would derive 51 percent of its electricity generation from gas plants—both combined cycle (CC) and combustion turbine (CT)— 25 percent from nuclear plants, 14 percent from imports of electricity from other states (mostly imports of coal-generated electricity in West Virginia), 2.5 percent from coal, 2 percent from hydroelectric, 1.4 percent from biomass, and 1.5 percent from solar (See Figure 9).[4]
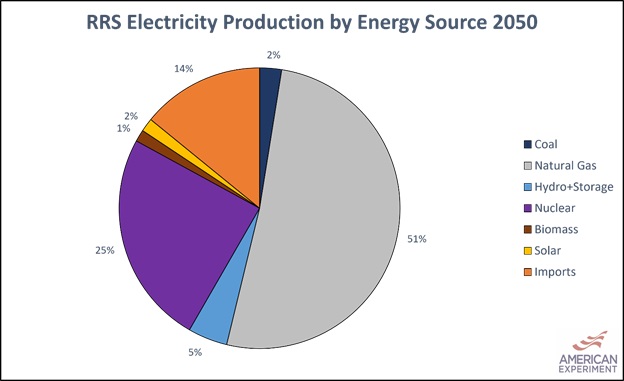
Figure 9. Natural gas would account for more than 51 percent of electricity generation in Virginia by 2050, while the next largest sources would be nuclear (25%) and imports (14%), followed by hydro plus storage (5%), solar (2%), and biomass (1%).
The changing electricity generation mix under the VCEA will have profound impacts on the cost of electricity for Virginia families and businesses and on the reliability of the electric grid in the Commonwealth. In contrast, the RRS would enhance reliability at a low cost.
RRS Costs
RRS costs are driven by relicensing Virginia’s existing nuclear power plants and building new natural gas capacity to ensure Virginia has enough capacity to meet peak electricity demand without relying upon imports outside of the coal plants operated by Appalachian Power in West Virginia.
The costs associated with the RRS scenario would total $15.5 billion through 2050 and would increase electricity rates gradually by as high as 8.6 percent by 2035. This translates to an additional cost as high as $208 per customer by 2035 –roughly $3,300 less than the high of the VCEA scenario.
Residential ratepayers would see an average annual cost increase of $88, peaking at $135 in 2035. (See Figure 10). Commercial and industrial ratepayers would see annual costs increase by an average of $520 and $16,600, respectively, both peaking in 2035 at $800 and $25,000. (See Figures 11 and 12).
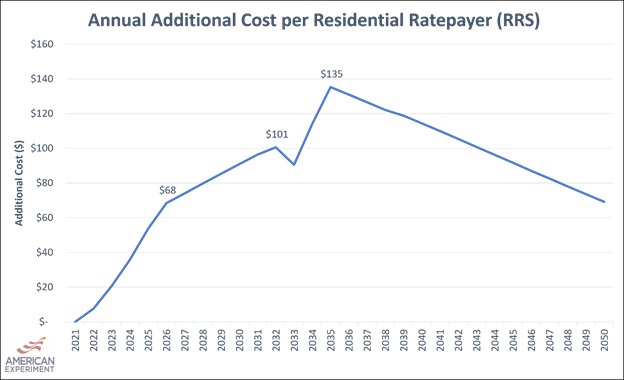
Figure 10. Residential electricity consumers in Virginia would see their electricity costs increase by an average of $88 per year.
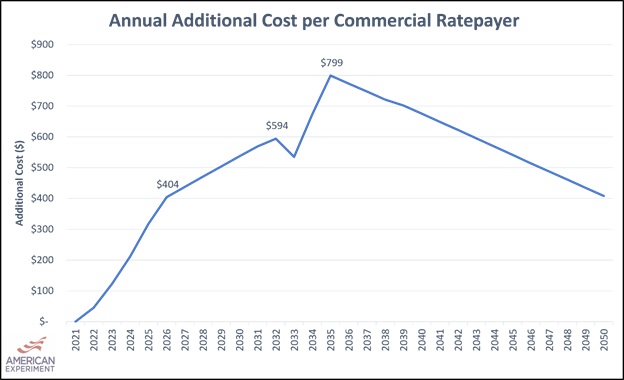
Figure 11. Commercial customers in Virginia would see electricity costs increase by $520 on average through 2050.
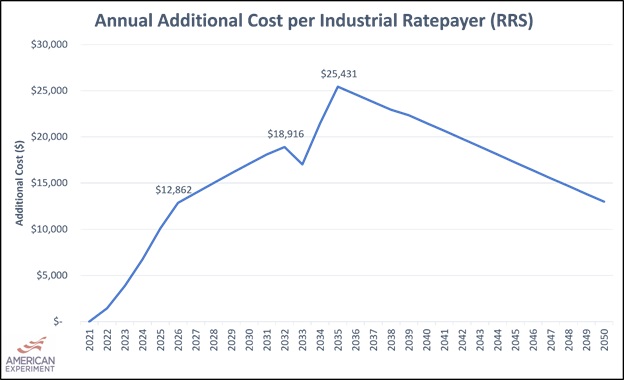
Figure 12. Industrial customers would see electricity costs increase annually by $16,600 on average under the RRS.
RRS Capacity
The amount of additional capacity needed under the RRS would be minimal because this plan prioritizes the continued operation of reliable power plants in Virginia and the construction of new natural gas plants that can be turned on and off, or dispatched, as needed to meet the demand for electricity at any hour of the day, regardless of weather conditions.
Figure 13 below shows the amount of installed capacity on the Virginia electric grid growing from 26,300 MW in 2021 to 31,200 MW by 2050.
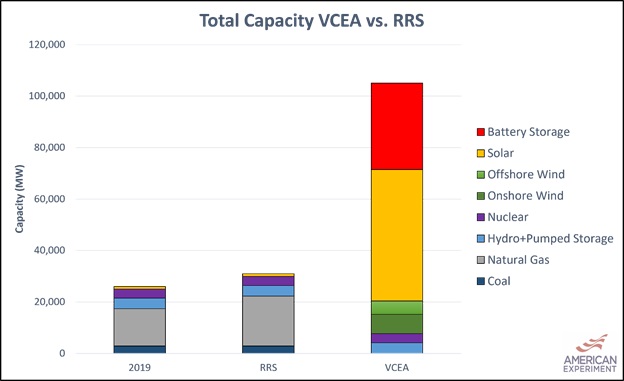
Figure 13. Capacity installations to comply with VCEA requirements will dwarf that of the RRS, which only adds less than 5,000 MW of capacity to the current grid.
Implications for Reliability
The RRS makes the Virginia electric grid more resilient over time by maintaining reliable generators and adding additional natural gas capacity to reduce the state’s reliance on imports. While Virginia’s import ability would still be intact, this scenario ensures that the state is able to meet demand and maintain reliability in the event that imports are unavailable
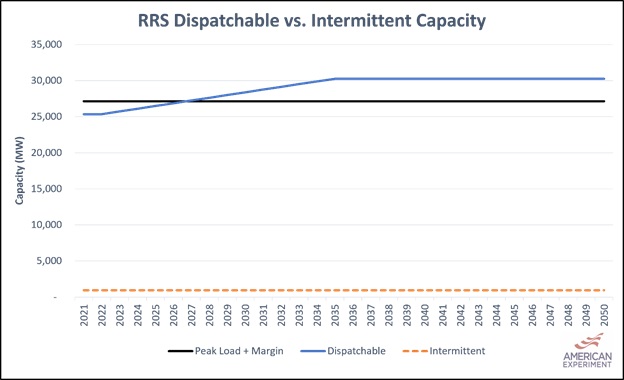
Figure 14. Dispatchable capacity in the RRS would increase to more than 30,000 MW, which is enough capacity to reliably meet all of Virginia’s needs without imports.
[1] See “Plant Construction by Type,” in the Appendix. These installed capacity estimates are consistent with proposals in resource plans submitted by Dominion and Appalachian power. Combined, these utilities companies project a roughly 3:1 solar to wind ratio for VCEA compliance.
[2] Existing LCOE values were calculated using FERC Form 1 data. New LCOE values were calculated using EIA cost assumptions in the Annual Energy Outlook (AEO) and region-specific capacity factors.
[3] U.S. Department of Energy, “Virginia,” Low-Income Energy Affordability Tool, accessed January 19, 2022, https://www.energy.gov/eere/slsc/maps/lead-tool.
[4] U.S. Energy Information Administration, “Virginia,” State Data Profile, Accessed January 20, 2022, https://bit.ly/3qI2I0F.