Minnesota’s new jobs are increasingly found in lower productivity sectors
As we explain in our our new report, The State of Minnesota’s Economy: 2017, Minnesota has a lower unemployment rate than the United states generally. Through 2016, it averaged 3.9%, well below the national figure of 4.7%. It is good to have a higher share of your population working, as I wrote last week, but the point of work is to produce goods and services. That is the aim of employment, not employment itself. And Minnesota’s new jobs have increasingly been found in sectors where each one generates less output.
Job growth in Minnesota lags the national average
Despite the goods news on Minnesota’s unemployment rate, the picture isn’t all good. As Figure 1 shows, in each of the last five years, the rate of job growth in Minnesota has been below the national average. Between 2000 and 2016, Minnesota’s growth rate of new jobs ranked 28th out of 50 states, as shown in Figure 2.
Figure 1: Employment growth in the United States and Minnesota (2000=100)
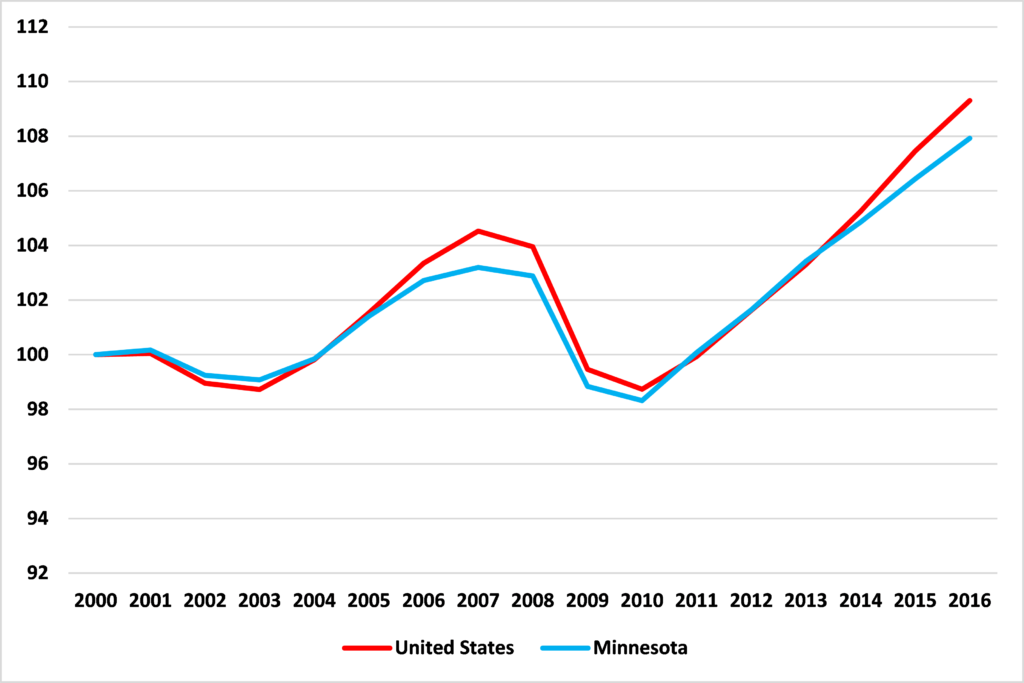
Source: Bureau of Labor Statistics
Figure 2: Employment growth, 2000 to 2016
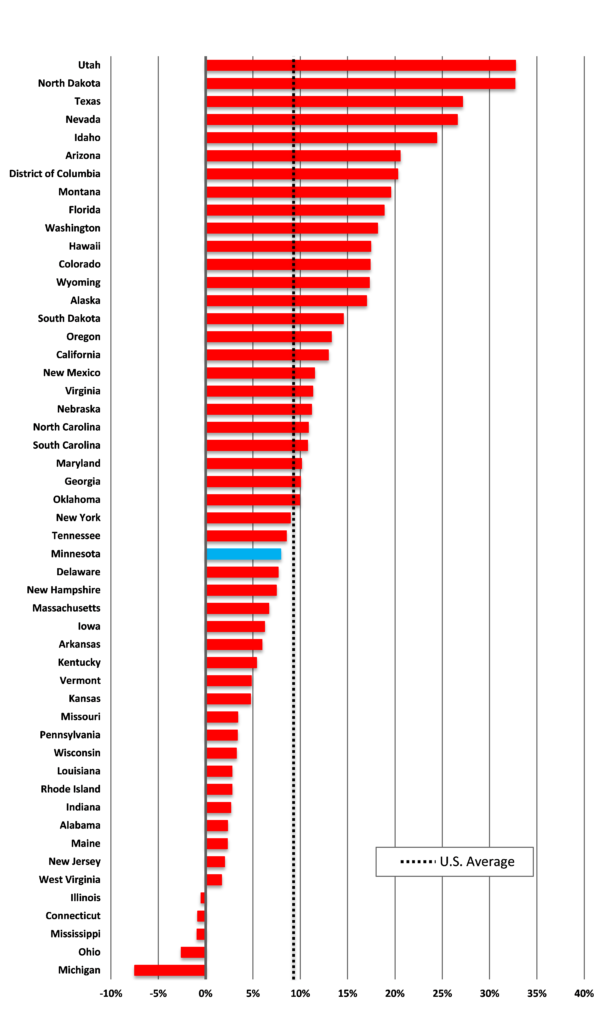
Source: Bureau of Labor Statistics
There are variations within the sate, as Figure 3 shows. The strongest employment growth springs from the suburban and exurban areas in the western portion of the Twin Cities and along the St. Croix. In Greater Minnesota, such as along the Minnesota River valley, however, the number of jobs has fallen.
Figure 3: Change in Total Employment, 2000 to 2015
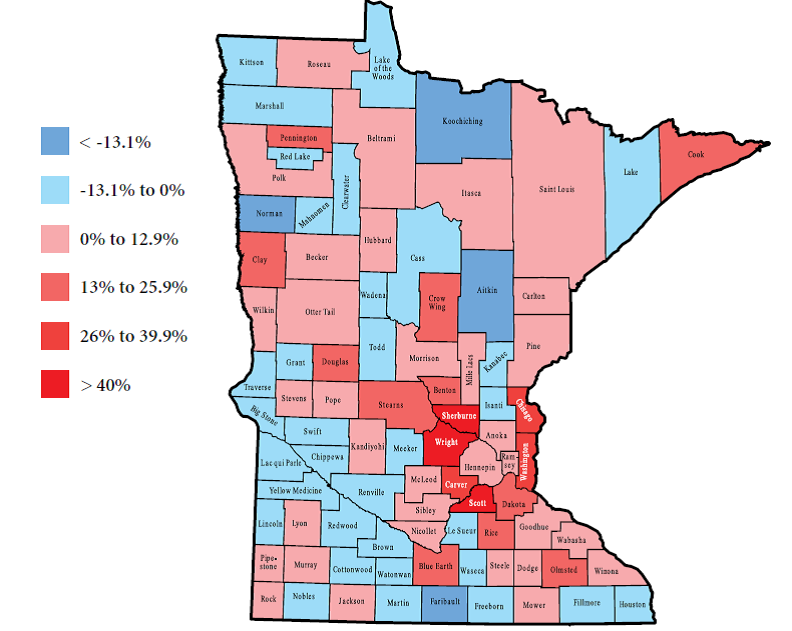
Source: Bureau of Economic Analysis
Job growth in the Twin Cities lags their peers
It is a similar story in the Twin Cities. While having a low rate of unemployment, of the 15 Metropolitan Statistical Areas with the largest GDP in 2016, job growth in the Twin Cities ranked 11th between 2000 and 2015, as shown in Figure 4.
Figure 4: Percentage change in Total Employment, 2000 to 2015
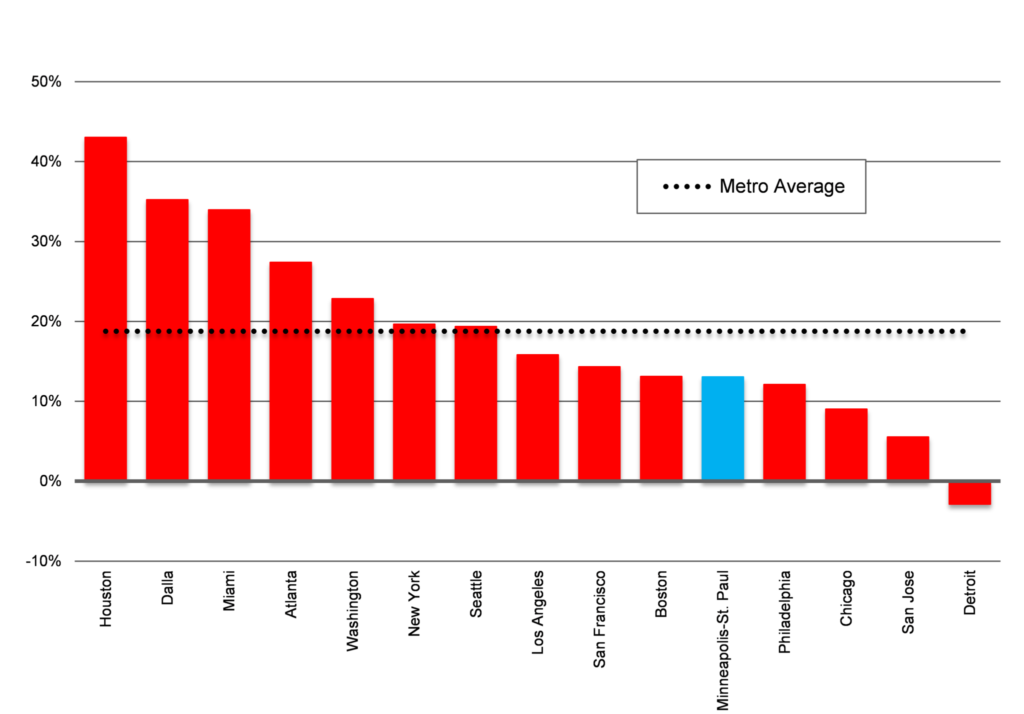
Source: Bureau of Economic Analysis
Minnesota’s new jobs are increasingly found in lower productivity sectors
Jobs may be growing in Minnesota at close to the same rate as the U.S. as a whole, but what types of jobs are we getting?
Figure 5 shows the Gross Value Added (GVA) associated with the average job in various occupational categories as well as the percentage increase or decrease in those jobs since 2000. In some occupations with a high GVA per job, such as mining, information, and manufacturing, the number of jobs has stagnated or even fallen. Mining & Logging, for example, generated $447,603 per job in 2016 and Information $319,596. But, in the previous sixteen years, Minnesota lost 23.5% of its jobs in Mining & Logging and 26.9% of those in Information. In contrast, the fastest growing occupations, Health Care and Educational Services, have a relatively low GVA per job. Health Care jobs, for example, generate an average of $88,761 of GVA annually, but jobs there have increased by 60.8% since 2000. Educational Services jobs generate an average of $58,239 of GVA annually, and employment in that sector has risen by 61.2% over the same period. For as long as this continues to be the case, net job growth may not imply rising per capita GDP.
Figure 5: Minnesota GVA per worker and job growth
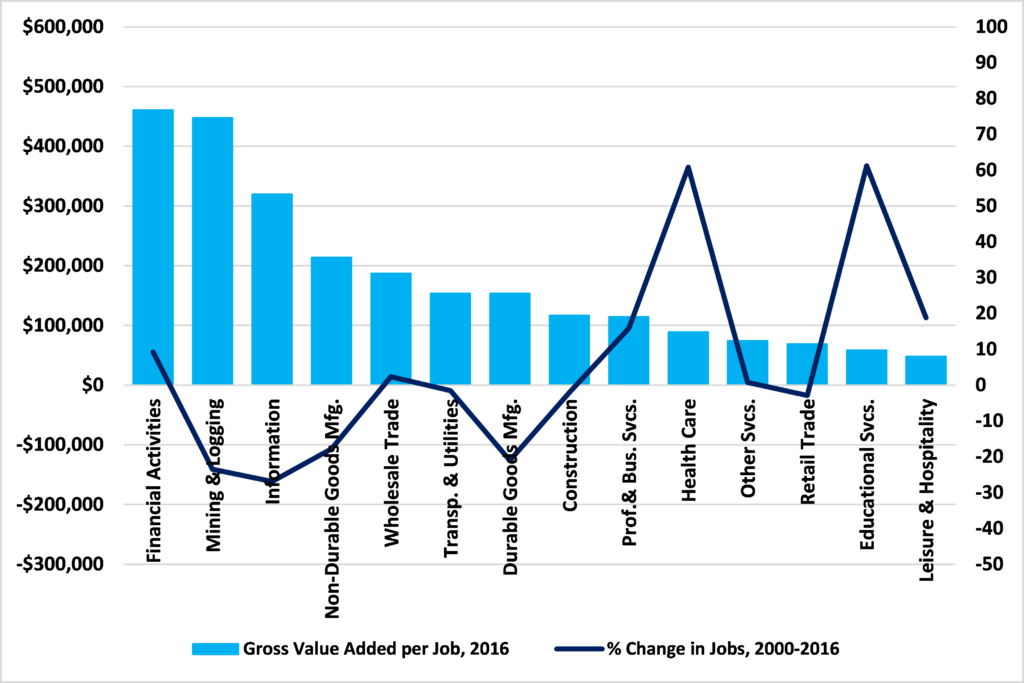
Source: Bureau of Labor Statistics; Bureau of Economic Analysis
Health care and social-assistance work is vital and should not be denigrated. But the growing share of Minnesota’s workforce employed in it represents an economic problem for our state. If we are going to pay for the health care and social assistance the elderly in our state will need, we need more productive jobs in Minnesota.
John Phelan is an economist at the Center of the American Experiment.