January employment report: Minnesota’s job growth is concentrated in lower productivity sectors
Yesterday saw the release of Minnesota’s job numbers for January.
They showed that our state added 2,500 jobs during the month. According to the Department for Employment and Economic Development (DEED),
Government led all sectors in January with 2,700 new jobs. Other sectors adding jobs were leisure and hospitality (up 1,200), professional and business services (up 500), other services (up 500), trade, transportation and utilities (up 400), manufacturing (up 300) and construction (up 100). Logging and mining held steady.
The following sectors lost jobs: education and health services (down 1,700), financial activities (down 1,400) and information (down 100).
Looking back over 2017, estimates of jobs gains were revised downwards from 44,200 to 30,606. December’s unemployment rate was revised upwards to 3.3%, still below the national average of 4.1%.
Over the last 12 months, the state created 25,512 new jobs in education and health services (8,236 jobs), government (7,581), construction (3,731), trade, transportation and utilities (2,854), professional and business services (1,749), and logging and mining (33). During the same period, the state lost 5,396 jobs in financial activities (1,518 jobs), leisure and hospitality (1,322), information (662), other services (504), and manufacturing (down 62). This gives a net gain to the state of 20,116 jobs the past 12 months. This represented a job growth rate of 0.7%, below the national rate of 1.5%.
This isn’t great news for Minnesota’s economy. The left hand axis of Figure 1 shows the Gross Value Added per job in fifteen sectors of the economy in 2016 (the most recent figures), using data from the Bureau of Economic Analysis. It goes from Financial Activities, where each job generates $468,784 of Gross Value Added to Leisure & Hospitality, where each job generates $468,784 of Gross Value Added. The right hand axis of Figure 1 shows the percentage change in employment in these sectors from January 2016 to January 2017 using the Bureau of Labor Statistics Current Employment Statistics.
Once again, we see a trend which was discussed in our recent report, The State of Minnesota’s Economy: 2017. Job growth has been highest in relatively low productivity sectors, such as Educational Services and Construction, and Government. By contrast, employment in higher productivity sectors such as Financial Activities and Information, has actually fallen.
Figure 1 – Gross Value Added per job and Minnesota’s job growth, January 2016 to January 2018
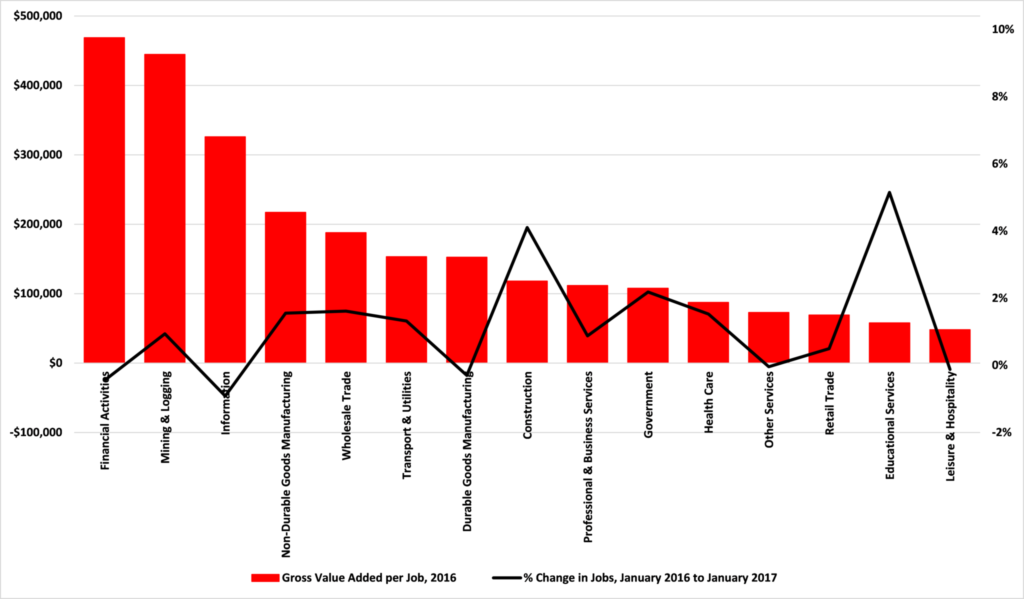
Source: Bureau of Economic Analysis and Bureau of Labor Statistics
To look at it another way, 30% of the 25,512 jobs created in Minnesota over the period January 2016 to January 2017 were in Government, the highest share. Second was health care and social assistance with 20% of the state’s new jobs over the period. By contrast, the leading category among the 5,396 jobs lost was Financial Activities, where 28% of the jobs lost were located.
As we have written before, this is in no way to denigrate jobs in these sectors. Health and education are vital. But to have high quality hospitals and schools and to be able to afford that week in the cabin Up North, we need high productivity, high wage jobs. This is key for the state’s economic future.
John Phelan is an economist at Center of the American Experiment.