Since 2010, per capita GDP has grown faster in Wisconsin than in Minnesota
I’m in Madison, Wisconsin, today to discuss that ever popular topic – the comparative performance of state economies.
As I wrote recently, comparisons of state economies are only useful up to a point. This is the case even for supposed ‘twins’ like Minnesota and Wisconsin. But they are not totally useless. They can even illustrate some economic fundamentals.
Since 2010, the amount of work done in Minnesota has grown faster than in Wisconsin…
There has been more job growth in Minnesota than in Wisconsin since January 2011. As Figure 1 shows, between December 2010 and August 2018, Total Nonfarm employment increased by 12.3% in Minnesota and by 9.2% in Wisconsin.
Figure 1: Growth in Total Nonfarm employment, Minnesota and Wisconsin, December 2010 to August 2018, December 2010 = 100
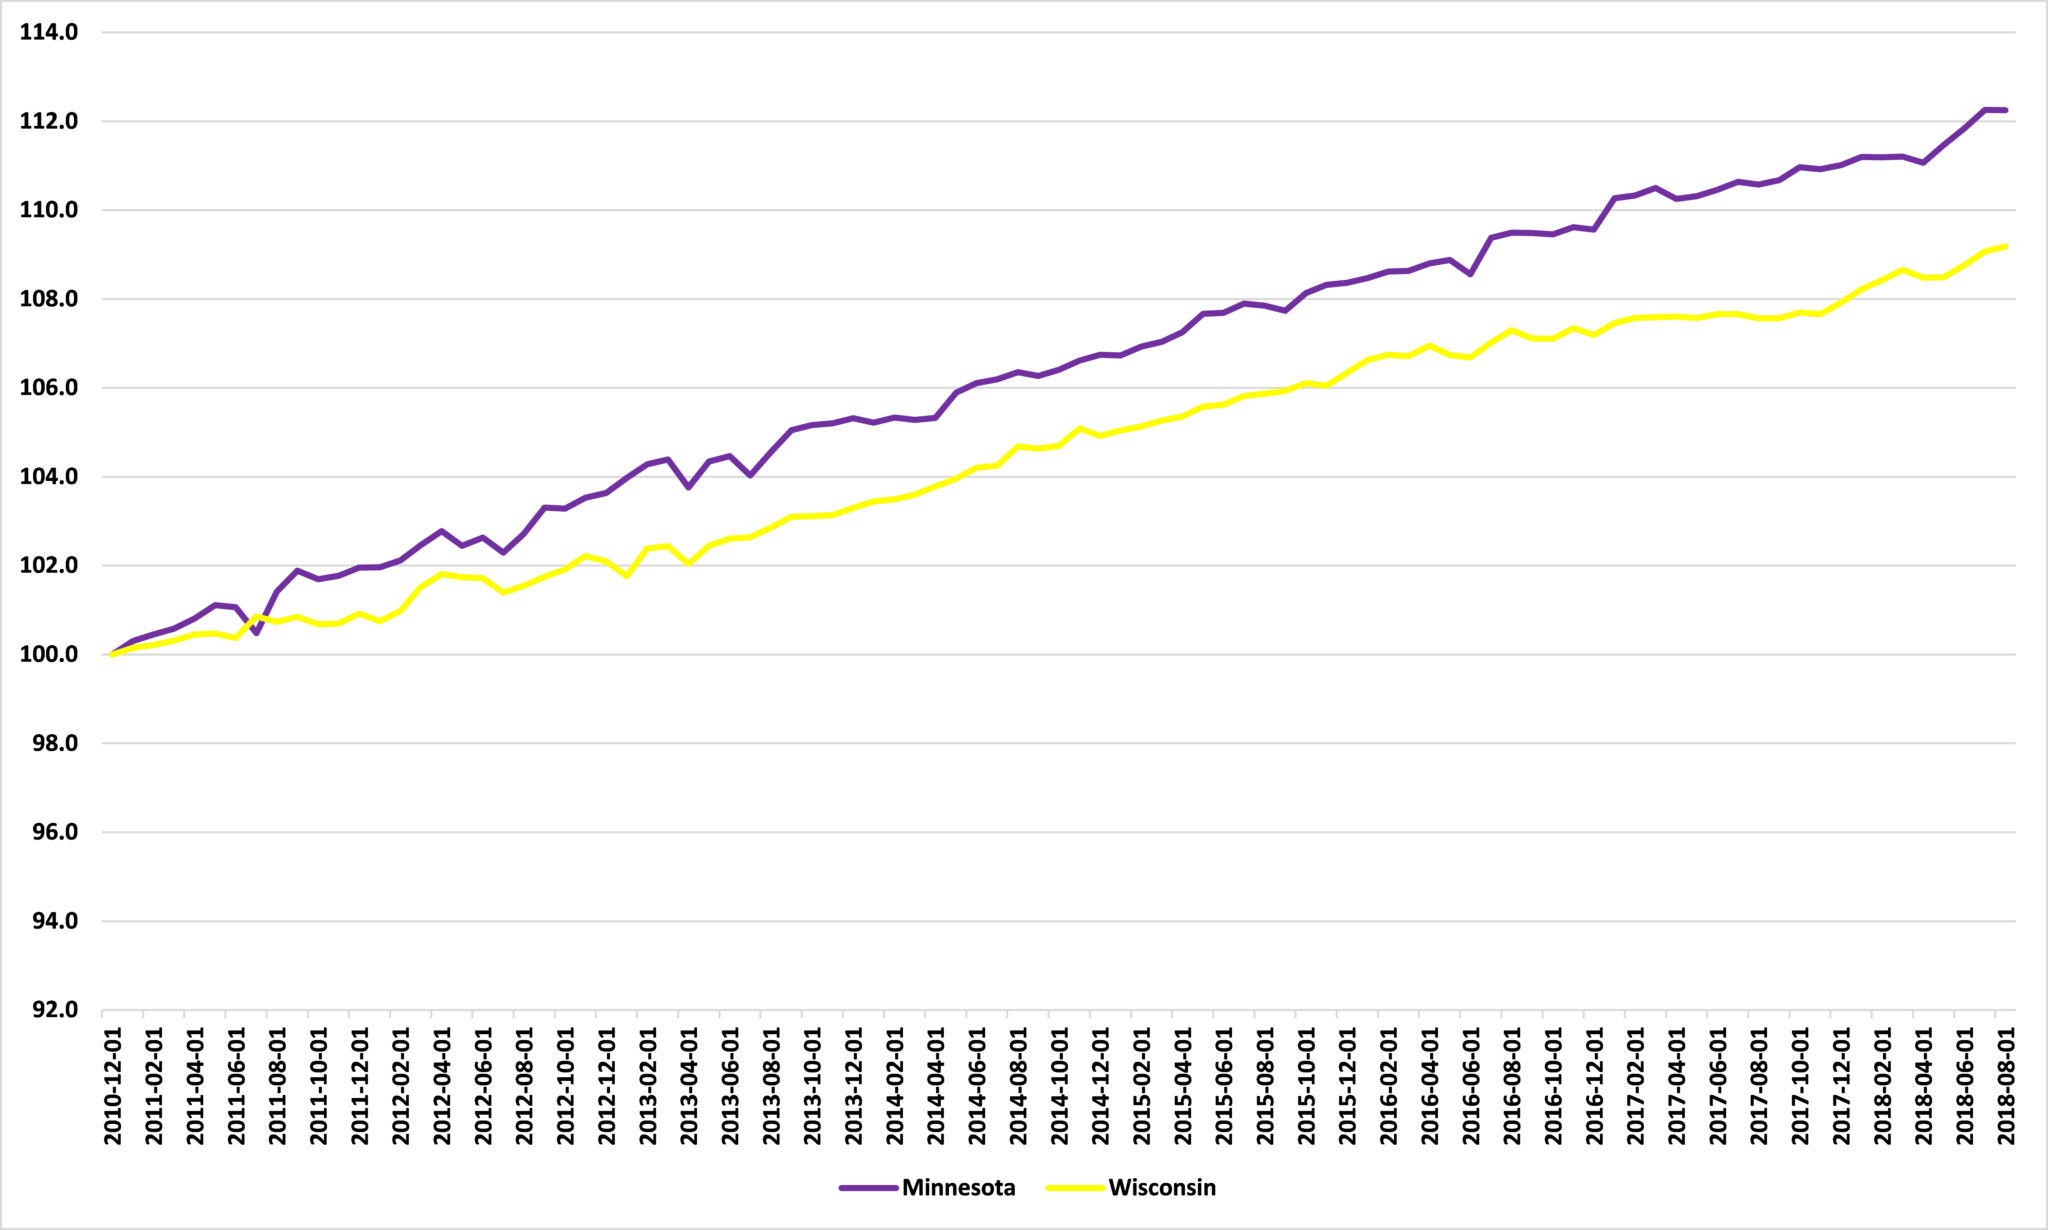
Source: Federal Reserve Bank of St. Louis
But, while Minnesota has performed better on job creation, Wisconsin has performed at least as well in reducing its unemployment rate. As Figure 2 shows, between December 2010 and August 2018, the unemployment rate fell by 4.2 percentage points in Minnesota (from 7.1% to 2.9%) and by 5.1 percentage points in Wisconsin (from 8.1% to 3.0%).
Figure 2: Unemployment rate, Minnesota and Wisconsin, December 2010 to August 2018
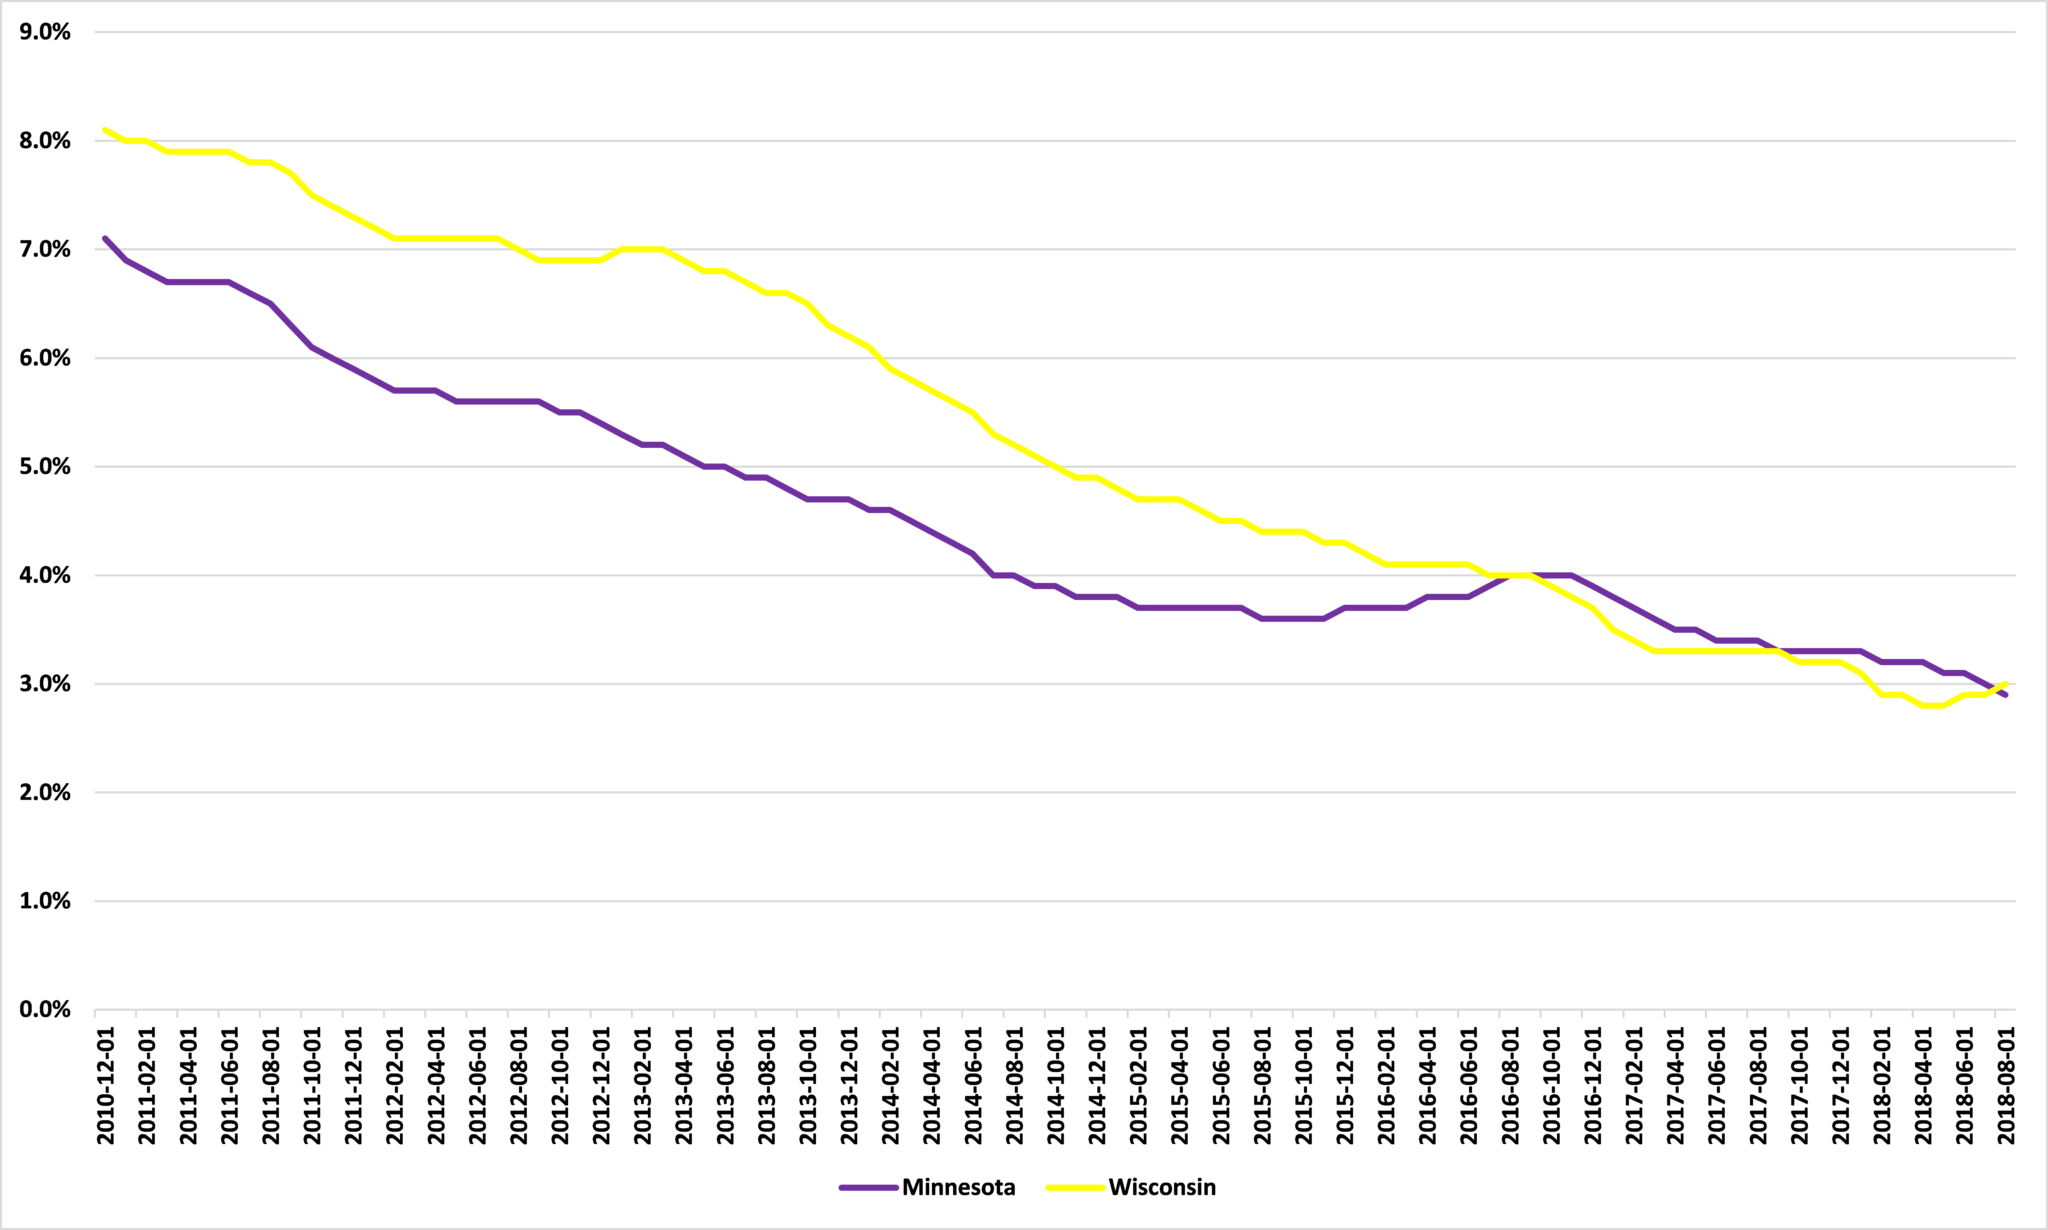
Source: Federal Reserve Bank of St. Louis
The reason for this is that population growth in Minnesota has outstripped that in Wisconsin. As Figure 3 shows, since the fourth quarter of 2010, Minnesota’s population has grown by 5.6% compared to just 2.0% in Wisconsin.
Figure 3: Population growth, Minnesota and Wisconsin, Q4-2010 to Q2-2018, Q4-2010 = 100
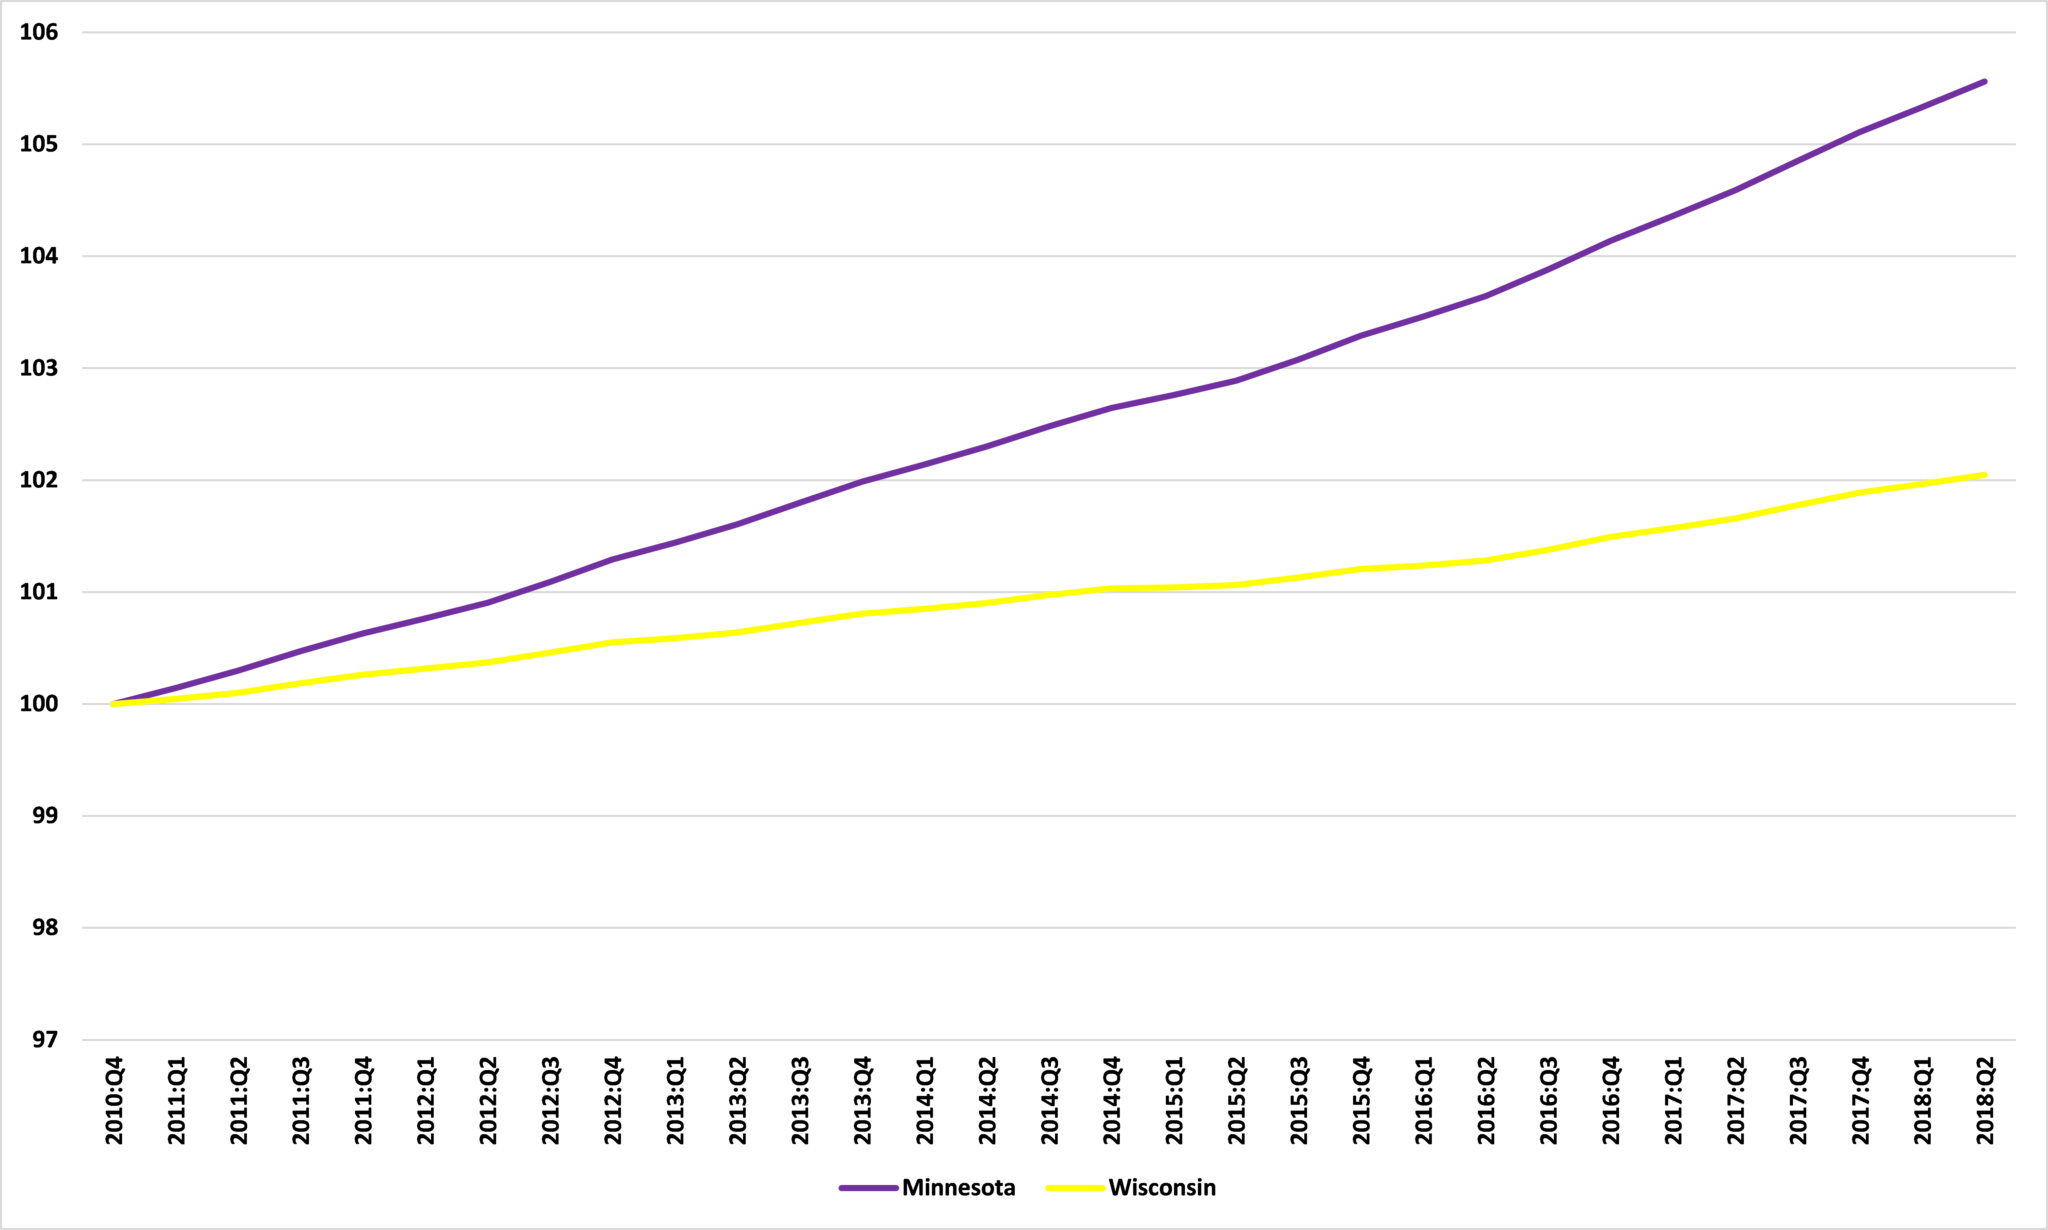
Source: Bureau of Economic Analysis
…but the amount produced by this work has increased faster in Wisconsin
So, this looks like 2-1 to Minnesota. But we shouldn’t stop there. The point of economic growth is to grow incomes in per capita terms. This means producing more per person, not simply throwing in ever more people. And here, on this more fundamental measure, Wisconsin has performed better since January 2011. As Figure 4 shows, between the fourth quarter of 2010 and the first quarter of 2018, GDP grew in real terms by 11.3% in Minnesota but by 12.3% in Wisconsin.
Figure 4: Real GDP growth, Minnesota and Wisconsin, Q4-2010 to Q1-2018, Q4-2010 = 100
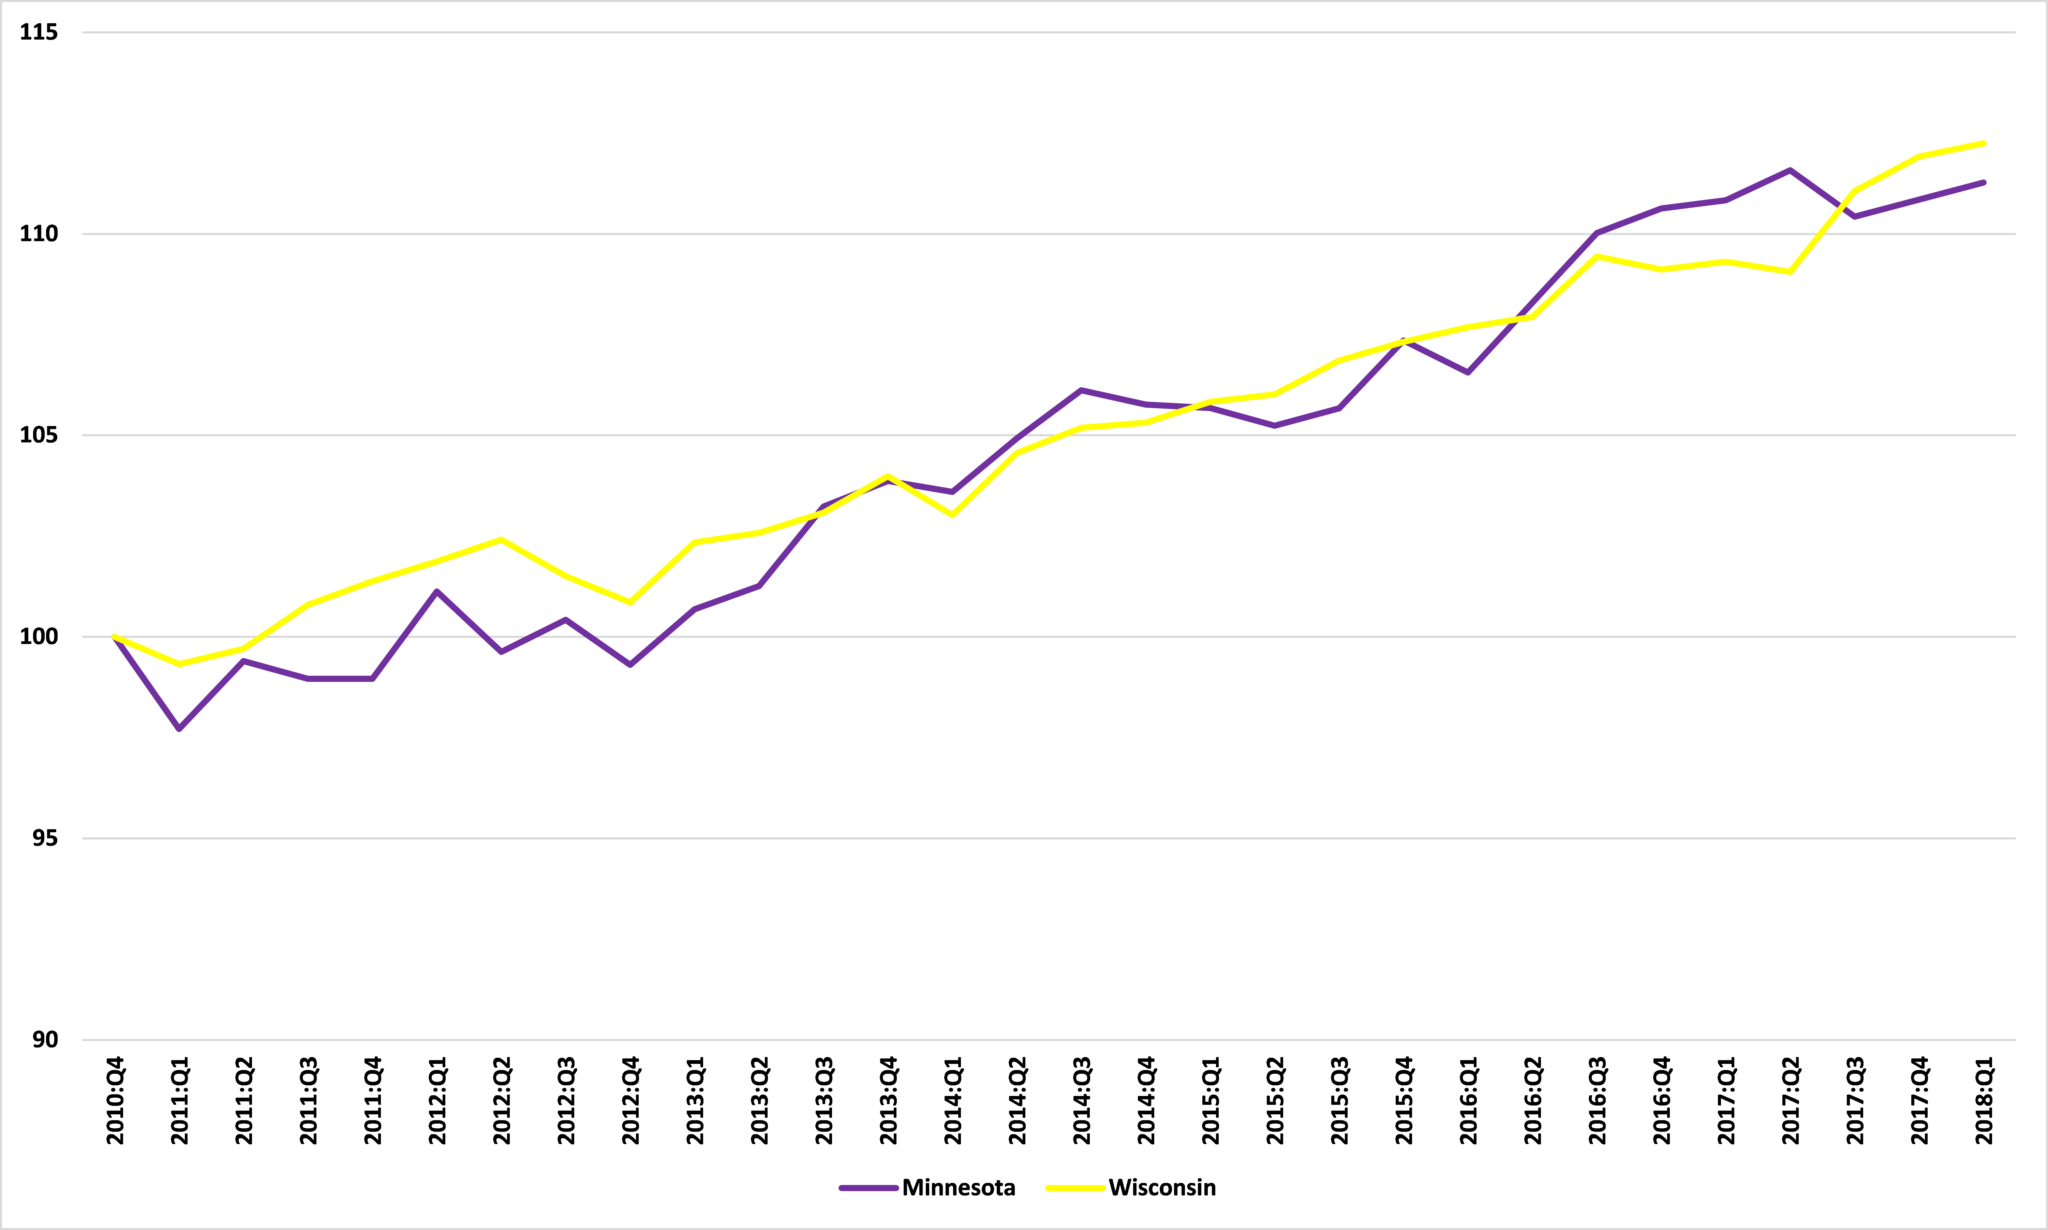
Source: Bureau of Economic Analysis
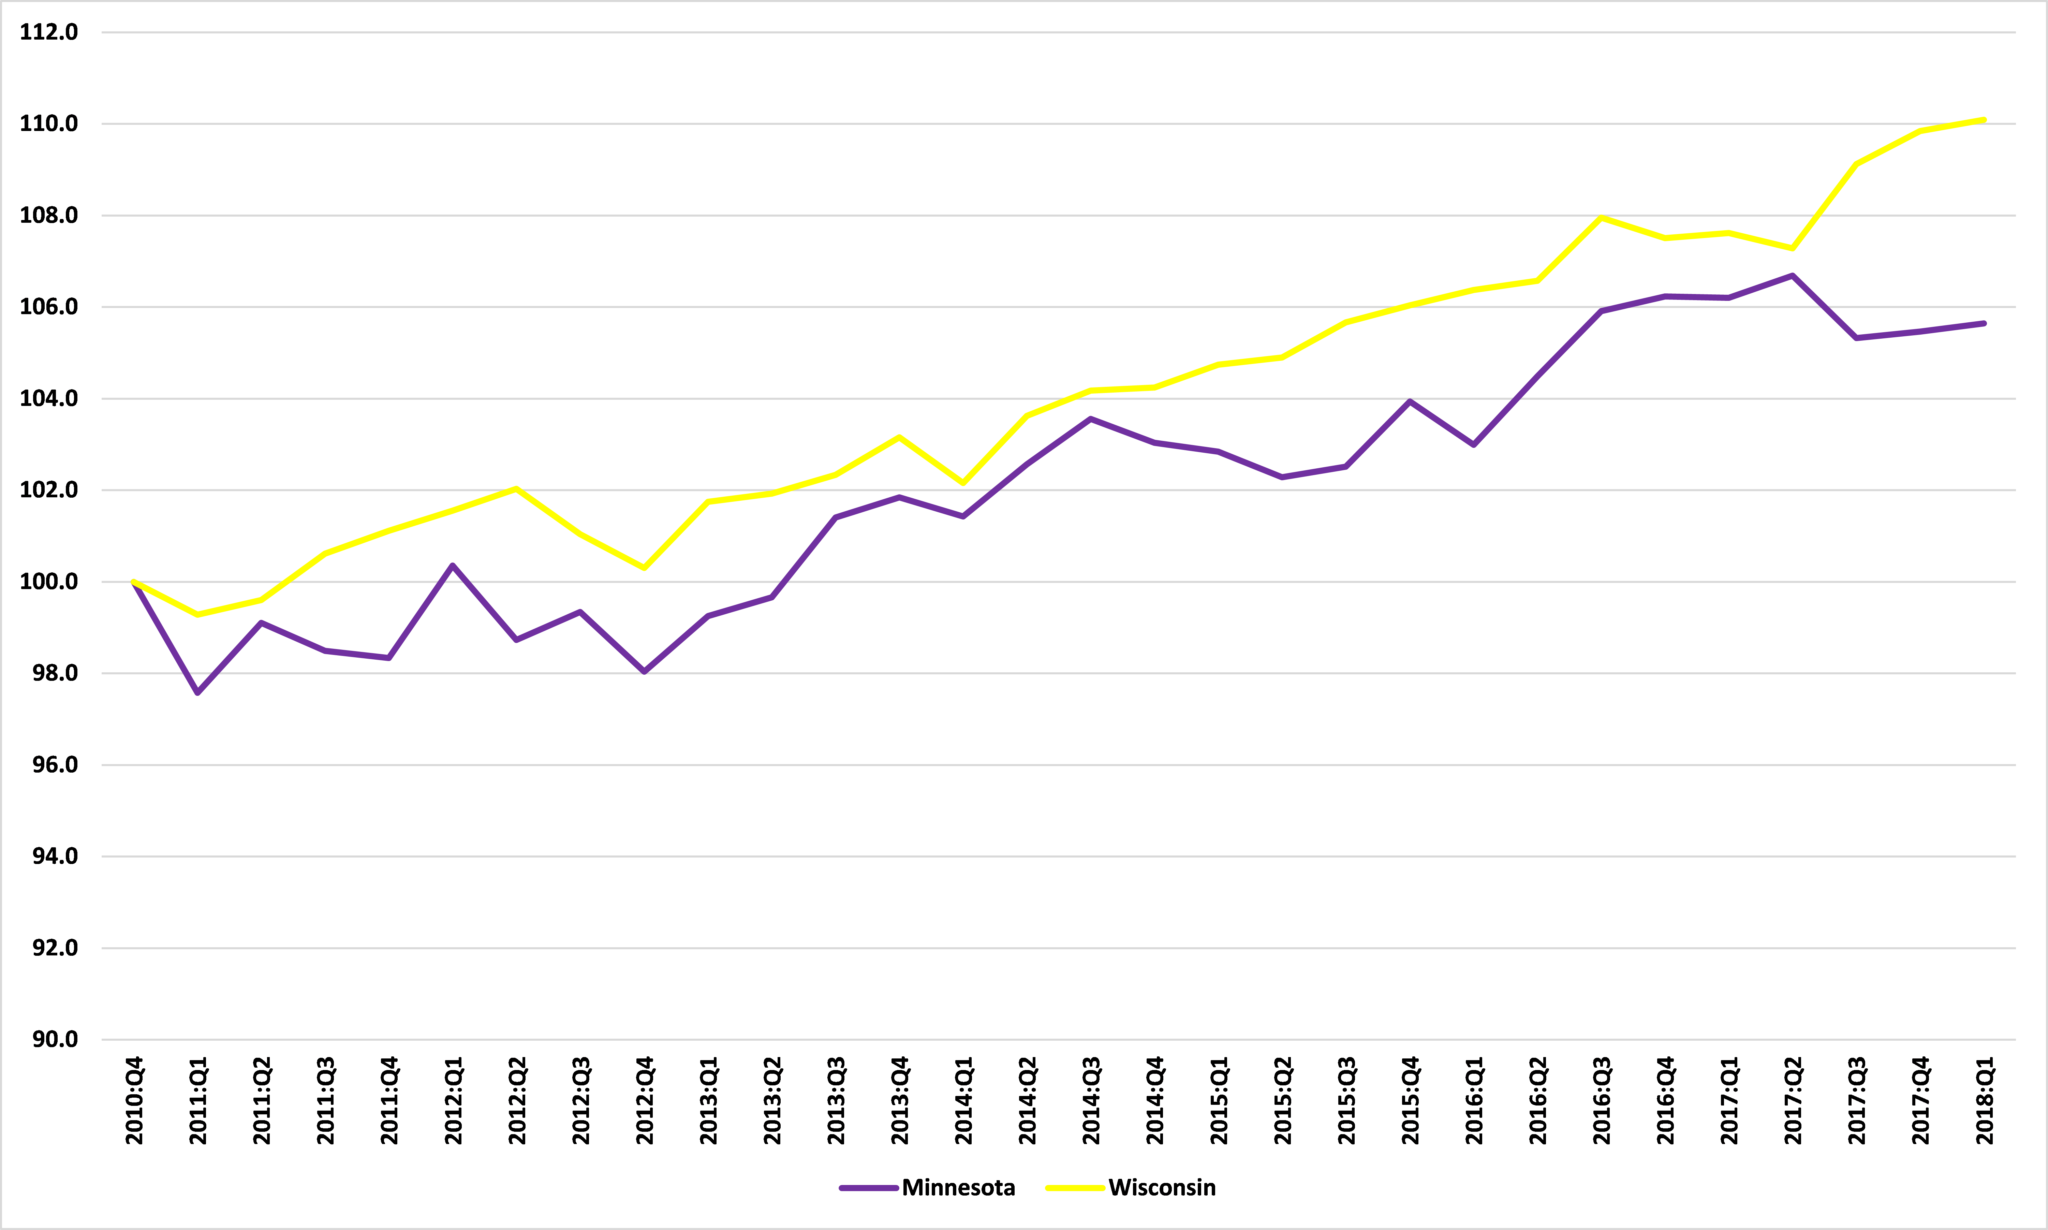
Ceteris paribus, Wisconsin’s higher rate of GDP growth would mean higher per capita GDP on that side of the St. Croix. But ceteris is not paribus in this case. When we add in Wisconsin’s lower rate of population growth, the divergence in per capita GDP growth is even more stark. As Figure 5 shows, between the fourth quarter of 2010 and the first quarter of 2018, per capita GDP grew by 10.1% in Wisconsin compared to just 5.6% here in Minnesota.
Figure 5: Real per capita GDP growth, Minnesota and Wisconsin, Q4-2010 to Q1-2018, Q4-2010 = 100
Source: Bureau of Economic Analysis
In the context of Minnesota’s supposed ‘labor shortage‘, there are those who say that we need an ever expanding population to guarantee continued economic growth. While that might help to grow overall GDP, it is not a given that it will increase per capita GDP, which is what matters for living standards. If population growth is going to be pursued as a method to increase GDP per capita, what is needed is new Minnesotans who are more productive than the average Minnesotan already here.
On this score, Wisconsin has done better than Minnesota. If we divide the new GDP generated in Minnesota between Q4-2010 and Q1-2018 by the new population gained over that period, we find that each new Minnesotan was associated with a rise in GDP of $104,941. For Wisconsin, that figure was $268,250.
As we noted in our report The State of Minnesota’s Economy: 2017 last year, Minnesota’s workers are less productive than the national average. This needs to change for the economic well-being of the state. The same goes for the new Minnesotans too.
John Phelan is an economist at the Center of the American Experiment.