Minnesota’s public schools have little to show for decades of increased spending
Allergic to Accountability
Minnesota’s public schools have little to show for decades of increased spending
This is a report by Catrin Wigfall. You can download the PDF version here.
Are we really that good?
Hailed as having one of the best public education systems in the nation, the reality of Minnesota’s public schools is like the tip of the proverbial iceberg—hidden beneath our seemingly high rankings are educational disparities and shortcomings that have not disappeared despite decades of increased spending.
And yet, unrelenting claims by spending advocates and teachers’ unions that our education woes are caused by insufficient spending drive policymakers and state leaders to dedicate billions of dollars—and 41 percent of the state’s budget—to education funding.
Unfortunately, Minnesota taxpayers have little to show for their investment. The all-too-familiar trend of mediocre performance and declining test scores paired with a persistent achievement gap is unacceptable, and continuing to pour more money into a broken system and hoping for different results is bad policy.
According to Center of the American Experiment’s Spring 2020 Thinking Minnesota Poll, 59 percent of registered voters in the state grade Minnesota’s public schools an “A” or “B.” When asked specifically about the public schools in their local community, 66 percent of respondents gave them an “A” or “B.”
Minnesotans take pride in their public schools. They read state rankings like those published by Education Week that ranked Minnesota 7th nationally in 2019 for K-12 achievement, and U.S. News & World Report that ranked Minnesota 12th nationally in 2019 for its pre-K-12 education system.
But these popular reports can be misleading because they fail to provide an “apples to apples” comparison between states. “By treating states as though they had identical students, they ignore the substantial variation present in student populations across the states,” according to a Cato Institute report by Stan Liebowitz and Matthew Kelly. “Conventional rankings also include data that are inappropriate or irrelevant to the educational performance of schools. Finally, these analyses disregard government budgetary constraints.”
Measures such as graduation rates that U.S. News and other organizations use to rank K-12 education systems are not necessarily an indication of actual learning. For example, Minnesota requires a certain number of credits in core courses to earn a high school diploma. But high schools often provide course credit based on hours of class time rather than knowledge of, let alone mastery of, core concepts. Even with strong coursework requirements, the learning needed to pass courses can vary from district to district, allowing students who don’t demonstrate basic proficiency to still accumulate graduation credits.
Furthermore, student demographics can disguise educational outcomes; a state like Minnesota whose student body is nearly 65 percent white might do well on state rankings due to its socioeconomic composition rather than any great achievement by its education system because state rankings do not account for student diversity.
Education rankings like U.S. News include average scores on tests administered by the National Assessment of Educational Progress (NAEP)—the only assessment that measures what students know and can do in various subjects across the nation and states—but these rankings ignore student heterogeneity despite NAEP results providing demographic breakdown of student scores by state. This omission skews the rankings in favor of states with fewer socioeconomically challenged students. Researchers Liebowitz and Kelly reconstructed the 2018 U.S. News state rankings using the same 2017 NAEP test score data as U.S. News but included scores from all subjects tested within the four major ethnic groups (whites, blacks, Hispanics, and Asian/Pacific Islander)—which U.S. News omits— and excluded factors such as graduation rates that don’t measure learning—which U.S. News includes. By using all of the NAEP data instead of only part of it, the differences in rankings are substantial: Minnesota’s education system that U.S. News ranked 7th nationally in 2018 dropped to 33rd.
Perhaps just as problematic, Liebowitz and Kelly continue, are education rankings that conflate inputs and outputs. “For instance, Education Week uses per-pupil expenditures as a component in its annual rankings. When direct measures of student achievement are used, such as NAEP scores, it is a mistake to include inputs, such as educational expenditures, as a separate factor.” This boosts the rankings of states that spend significantly more but achieve the same academic results as states with fewer resources.
Spending is not down
Liberal politicians and school-spending advocates portray “insufficient” spending as the main problem with Minnesota’s public education. According to Education Minnesota President Denise Specht, Minnesota needs to spend about $4 billion more every two years to “fully fund” public schools and solve the state’s problems.
But data show that there is no direct correlation between increased spending and improved academic outcomes. And inadequate school spending is not among the causes of achievement gaps by race, class, and zip code. The false narrative that inadequate funding is the root of our education problems paints Minnesota as a state allergic to accountability. Minnesotans spend more money for education year after year, yet they fail to get the most bang for their buck. And our students are paying the cost: too many are being left behind in the shadow of success.
Total revenue per pupil has consistently increased since 2003—both adjusted for inflation and not adjusted for inflation. According to the most recent U.S. Census Bureau data, Minnesota spends on average $12,975 per student each year.
But misleading rhetoric leaves the general public believing Minnesota spends far less on education than we actually do. According to the Spring 2020 Thinking Minnesota Poll, the median dollar amount Minnesotans guessed the state spends per pupil was $3,000.
There is clearly a disconnect between rhetoric and fiscal reality.
Minnesota has also continued to appropriate more money for education spending into the education fund, with its current general fund expenditures for fiscal year 2020-21 at $20.1 billion, according to the Senate Counsel, Research, and Fiscal Analysis (SCRFA). The bulk of the budget goes toward general education aid ($15 billion) followed by roughly 17 percent to special education ($3.4 billion). The 2019 two-year budget deal gave a $540 million boost to the education fund—the biggest single spending increase in that budget. By 2022-23, the SCRFA has estimated education spending will increase to nearly $21 billion or 4.4 percent above fiscal year 2020-21.
At 41.3 percent of the state budget, education consumes a larger share of spending than public safety, transportation, and health and human services combined.
The money is spent on classroom instruction (teachers’ salaries and benefits), support services for students and teachers, school administration, transportation, food services and facility operations, early education, capital costs (building and maintaining facilities), and state agencies, to name a few. But understanding the different budget categories and how money flowing in is allocated is complex. A guidebook provided by the Minnesota House Research Department to explain how public schools are funded in Minnesota is over 130 pages long.
School districts receive basic education revenue, which is determined by a formula allowance and adjusted pupil counts for the school year, and can receive other dollars through extended time revenue, gifted and talented revenue, small schools revenue, declining enrollment revenue, local optional revenue, basic skills revenue, operating capital revenue, transportation revenue, elementary and secondary sparsity revenue, equity revenue, transition revenue, and pension adjustment revenue. Out of Minnesota’s 331 eligible school districts, nearly all qualify for at least half of the above listed revenue components.
The extent to which the revenue, particularly the state funding aimed at closing educational disparities, has an impact on student achievement is unknown, according to an evaluation report from the Office of the Legislative Auditor (OLA). Nearly $600 million a year ($551 million in fiscal year 2018) is sent directly to school districts across the state to pay for the educational needs of students who do not meet performance standards appropriate for their age. This “basic skills” revenue is the largest single stream of funding aimed at closing the state’s achievement gap. It includes compensatory revenue intended to help underperforming students and English learner revenue to help students with limited English skills. In addition, federal Title I funds provided to schools with high percentages of low-income students and other state funding (“achievement and integration” aid, early education money, rural school money, etc.) are also used to help at-risk students and move the achievement gap needle. With little detail provided on how school districts spend the revenue, and inconsistencies in how districts track spending, more accountability is necessary to remedy the lack of transparency in spending and its results.
Fully understanding budget categories and who gets the lion’s share is complicated, but the multiple streams of funding going into education have not translated into more learning, leaving disparities to continue to plague our state.
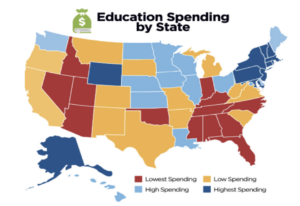
At $12,975 in annual per pupil spending, Minnesota spends more than the national average ($12,612), but it is outspent by several higher-spending states (such as New York and Alaska) and the District of Columbia. However, it is still considered a high spending state relative to spending across the country.
When states’ per pupil spending is paired with academic achievement results, there is an absence of direct correlation between spending and achievement. The graphs nearby show per pupil expenditures by state and average normalized National Assessment of Educational Progress reading and math test scores by state.17 Before adjusting state spending for cost-of-living differences, the regression line has a slight upward trajectory, but would be a much steeper line if there was a strong correlation between spending and achievement. After adjusting state spending for cost-of-living differences, the correlation between expenditure dollars and academic achievement outcomes is even weaker. The scatterplots do show states with the most efficient educational systems and the states that are spending a high dollar amount per student for mediocre performance. States near the upper left corner of the graphs get greater value for their education spending than states found in the lower right corner. For example, New York spends over $24,000 per student, yet its students’ performance on NAEP exams is not any higher than the performance of students in states that spend half that amount. Florida, on the other hand, spends $9,346 per pupil and its student performance is the third highest.
What does Minnesota get for its consistent spending increases? Worse results.
Lackluster academic outcomes
Minnesota test results from well over a decade ago reveal a familiar tale of woe for the state’s public schools: academic outcomes stagnant or in decline and an achievement gap that won’t budge.
In 2018, Minnesota launched its North Star accountability system to satisfy the requirements of the federal Every Student Succeeds Act (ESSA) and the state’s World’s Best Workforce law (WBWF). The system is intended to identify schools and districts requiring improvement support based on academic achievement levels, progress toward English language proficiency, academic progress from one year to the next, graduation rates, and consistent attendance. North Star identified 357 schools for improvement in 2018, with no new schools identified for support in 2019. Criteria for showing when schools have improved is not clear.
The state measures student academic achievement primarily through the Minnesota Comprehensive Assessments (MCAs) and the Minnesota Test of Academic Skills (MTAS), an alternate assessment. These tests are given once a year based on students’ grade level and subject area and measure student progress toward Minnesota’s academic standards. Most students take the MCAs, but students who receive special education services may take the alternate assessment MTAS instead. The reading MCA or MTAS is administered in grades 3-8 and grade 10, and the mathematics MCA or MTAS is administered in grades 3-8 and grade 11. Science knowledge is assessed in grades 5, 8, and once in high school. As reading and mathematics are the primary assessments Minnesota uses to meet state and federal accountability requirements, these are the test results that will be discussed below.
Minnesota student achievement is also measured by NAEP scores. The NAEP test results that will be referenced below are mathematics and reading scores from grades 4 and 8. Participation in NAEP is required by federal law, and the math and reading assessments are administered to a sample of students who represent the student population of the states and nation as a whole. It is the only objective student learning outcome measure available to compare states’ academic performance, and it assesses how states are doing in preparing their students (i.e., whether state standards are rigorous enough).
Test scores
Test scores are not the only indicator of success, but they play a key role in evaluating learning because they are objective, standardized measures of student achievement on academic or proficiency standards. Tests can also place healthy pressure on schools, helping to identify which schools are struggling to meet the minimum academic expectations.
The MCA assigns four levels of achievement: Exceeds the Standards (proficient), Meets the Standards (proficient), Partially Meets the Standards (not proficient), and Does Not Meet the Standards (not proficient). Students receive an achievement level based on their scale score.
According to the 2019 MCA math test results, 44.6 percent of students assessed statewide—in grades 3-8 and grade 11—are not performing at grade level. In reading, 40.4 percent of students assessed statewide—in grades 3-8 and grade 10—are not performing at grade level. (The results are similar when both MCA and MTAS test scores are factored in.) And the results are even more discouraging when broken down by race/ethnicity. Around 45 percent of Asian students, nearly 68 percent of Hispanic students, 72 percent of American Indian/Alaska Native students, and 72.2 percent black students are not proficient in math. And even among white students, over 100,000 are not performing at grade level, equating to nearly 53 percent of the total student body that is not proficient in math. But our educational disparities are not confined to race. Low-income white students significantly trail higher-income white students across Minnesota.
The passage of time has not been kind to our hope for improved academic progress. Math scores have declined since 2016 and reading proficiency has been stagnant.
When looking at scores prior to 2016, it is important to keep in mind that there were changes made to the MCAs. The reading MCA was revamped in 2013 to align with national “Common Core” academic standards, and the mathematics MCA was revised in 2011 based on the state’s amended math standards. Both of these changes resulted in achievement drops for all students.
“Adaptive” computerized testing also plays a role when looking at student achievement. Starting in 2012 for younger students and 2016 for 11th grade students, adaptive testing provides a student with different test questions based on the student’s performance: if a question is answered correctly, the following questions get harder; if a question is answered incorrectly, the following questions get easier.
But what about students who opt out of standardized testing? Doesn’t that skew the data? The percentage of students who opt out of the MCAs is not significant enough to affect overall proficiency scores. On the 2019 MCAs, 2.5 percent of students opted out of the math assessment, and less than 2 percent opted out of the reading assessment.
Minnesota students have also declined in both reading and mathematics on NAEP tests. The average math NAEP score for fourth-grade public school students in the state declined from 249 in 2017 to 248 in 2019. In reading, the average fourth-grade score was 222 in 2019, down from 225 in 2017. For eighth-grade students, the average math NAEP score declined from 294 in 2017 to 291 in 2019. Eighth-grade reading scores dropped to 264 in 2019, compared to 269 in 2017.
And while these drops in scores may not seem significant, digging into the numbers reveals more of the story, and reveals Minnesota students’ performance relative to students in other states. Recall that these numbers are state averages and do not take into account the impact of student heterogeneity. Disaggregating groups of students gives a better picture of a state’s academic performance and helps put to rest the claim that more spending necessarily improves student performance.
For example, Texas—a state that serves similar student demographics as Minnesota—spends $9,606 per pupil compared to Minnesota’s $12,975 per pupil. Yet Texas black, Hispanic, and Asian/Pacific Islander students outperformed Minnesota black, Hispanic, and Asian/Pacific Islander students on each 2019 NAEP subject test for each grade level. Interestingly, Minnesota white students slightly outperformed Texas white students in both grade levels and subjects tested except for fourth-grade reading.
Mississippi, who spends $8,935 per student and whose student body is made up of nearly 49 percent black students compared to Minnesota’s 10.7 percent, has better academic performance than our state among students of color. Mississippi black and Hispanic students in both fourth- and eighth-grade math and reading outperformed Minnesota black and Hispanic students.
Equally important, Mississippi’s NAEP test scores for fourth- and eighth-grade black students have been scaling up over the years, compared to Minnesota’s declining scores and inconsistent growth among fourth- and eighth-grade black students.
When NAEP results are income adjusted (with controls for free and reduced-price lunch eligibility), Minnesota fourth-graders’ reading scores ranked 28th in the nation. Among low-income students in Mississippi—who make up 75 percent of the student body compared to Minnesota’s 37 percent—fourth graders’ reading scores ranked 2nd in the nation. Assuming that Minnesota must do a better job educating its students because it spends more money is not accurate.
Achievement gaps
Minnesota’s achievement gap is the disparity in academic performance between groups of students. It is most often used to describe the troubling performance gaps between students of color, at the lower end of the performance scale, and their white peers, as well as the similar academic disparity between students from low-income families and those who are better off. The state of Minnesota has not made meaningful progress in closing the achievement gap—which is one of the worst in the country—despite continued increases in spending and direct allocations of hundreds of millions of dollars each year to specifically target low-performing students.
The achievement gap between white and black students varies only slightly when comparing proficiency on the MCA and the NAEP.In fourth-grade reading, the 2019 MCA results show a 35 percentage-point achievement gap in proficiency between white and black Minnesota students. On the 2019 NAEP reading test, the scores of black and white fourth graders had an achievement gap of 26 percentage points. The achievement gaps for grade 8 reading proficiency and grades 4 and 8 math between the MCA and the NAEP range from 30 percentage points to 40 percentage points. Over the last five years, the math achievement gap on the math MCA has widened by 2.1 percentage points in grade 4 and 1.4 percentage points in grade 8. This widening gap is also paired with declining test scores for both white and black students in Minnesota. On the reading MCA, the achievement gap has widened by 0.5 percentage point in grade 4 and narrowed by 0.9 percentage point in grade 8 over the last five years.
While the third-grade reading achievement gap on the MCA has narrowed between white and black students in Minnesota by 5.7 percentage points since 2015, the gap closure is not a positive development because it is a result of white students’ proficiency declining.
Another academic achievement gap that is not as often discussed is the gap between white and Asian students. Interestingly, Minnesota white students outperform Minnesota Asian students on NAEP fourth- and eighth-grade assessments and have higher proficiency percentages on both the math and reading MCAs across all grade levels tested.
The achievement gap is also not limited to race. Only 37 percent of low-income Minnesota students of all races/ethnicities are proficient in math and reading compared to 68 percent of their higher-income peers. According to the most recent Thinking Minnesota Poll, 79 percent of Minnesotans think the achievement gap in the state is a significant problem.
Graduation rates and college readiness
Despite the sobering picture of Minnesota students struggling in literacy and numeracy—reflected not only in state test scores but in national test results as well—Education Commissioner Mary Cathryn Ricker described the “state of our students” as “promising,” following the release of the Minnesota Department of Education’s “first-of-its-kind” report in 2019 titled, “The State of Our Students.” The report misses the transparency mark by not reporting clear benchmarks and undermines the limited progress the state is making in boosting proficiency by praising increases in graduation rates.
But reductions in graduation gaps and increases in graduation rates do not automatically equate to improved learning nor are they an indicator of achievement. According to Minnesota Department of Education data, the number of African American students who graduated high school increased from 36 percent to 67 percent from 2003 to 2018 (compared to white graduation rates of 79 percent and 88 percent), but an analysis of college readiness tests by the Federal Reserve Bank of Minneapolis shows zero progress in closing the gaps in terms of actual learning. In 2013, the Legislature removed required minimum test scores for a high school diploma, diluting Minnesota’s high school graduation requirements and allowing students who don’t demonstrate proficiency to still graduate. Governor Walz has emphasized Minnesota’s increasing graduation rates as a positive development despite the fact students are coming up short on standardized tests.
According to 2019 ACT Research data, only 13 percent of black high school graduates met three or more college readiness benchmarks compared to 53 percent of their white peers. And 31 percent of Minnesota graduates met zero college readiness benchmarks. More students may be leaving high school with a diploma, but data show an increasing proportion of those students are unprepared for college and other post-secondary options.
Education ROI
Spending more on schools may be popular, but the state’s education shortcomings and disparities require policy solutions, not further cash infusions.
This analysis of Minnesota’s education system is not to dismiss external factors that can affect a child’s academic performance (such as parental involvement or student motivation) or be indicative of outcomes and quality in specific schools and districts. But it is meant to assess the state’s system as a whole and get us thinking about the question how good are Minnesota’s public schools, really? Why hasn’t the alarming academic performance trend among students of color caused more of a stir, especially given the dedication of a recent movement to racial equity?
Minnesota’s massive investment in K-12 education has not promoted strong student achievement, as additional dollars have not resulted in improved academic outcomes nor meaningful progress to close the achievement gap. This is not to say that money couldn’t matter in improving student outcomes, it is that it hasn’t. Better accountability on how finances are spent is a must.
According to research by The Education Trust, Minnesota is one of the most generous states in the nation with regard to funding for districts with high populations of low-income students and students of color. This remains true even after adjusting for the added costs associated with educating low-income students, many of whom start school academically behind their more affluent peers. The most recent data show the highest poverty districts receive at least 15 percent more funding per student than the lowest poverty districts. Districts serving the most students of color receive 14 percent more in state and local funds per student than districts serving the fewest students of color. And an analysis by the Urban Institute also places Minnesota as a top state concerning spending more on educating poor students—not only through local funding, that is often regressive, but through state and federal funding as well.
These investments are not paying off—the state’s multi-year academic track record has very little to show for the influx of cash the education fund has received. It does take time to move a test score average, but the speed at which students’ reading and math proficiency rates are declining is concerning. And the number of students who feel safe and engaged at school is also in decline.
Until we pursue solutions outside of the education “reforms” that have been tried ad nauseam, and until we stop assuming that monetary inputs will miraculously lead to our students catching up academically, our education system will not get the lasting change it needs and all our students will not get the education they deserve.
Policymakers and state leaders should focus less on automatically increasing the education dollar amount and more on the diminishing returns the state is getting for that additional spending. If they are going to continue arguing for increased school spending, they owe it to taxpayers and Minnesota families and students to make that argument in honest terms.
It is far time to hold the state accountable and ask, “Where are the results of all our spending?”
Recommendations
K-12 education in Minnesota is at a critical point. The student achievement needle and the achievement gap have hardly budged over at least the last decade, and it is time to recognize the limits of money as a solution by itself. Minnesota’s education system does not have a funding issue, as state education funding continues to rise, but results do not.
This new decade of education will require different ingredients if we hope to make meaningful progress in boosting academic outcomes and setting students up for success.
- Expanding the school choice continuum
- By passing the nation’s first charter school law in 1991, Minnesota pioneered a model for the rest of the country to follow. The state’s charter school statute structurally reformed public education’s governance system to better serve students most in need of new opportunities. But Minnesota cannot run on past success. Its historic innovation aimed at addressing educational challenges and improving education has not maintained momentum, and other states have surpassed Minnesota’s once-revolutionary approach through other successful strategies that tackle education shortcomings that Minnesota won’t consider. By expanding the school choice continuum to include real school choice—religious and private schools—and removing barriers such as financial restraints that prevent families from accessing these options, students who need alternative educational options to succeed have more of an opportunity to access them.
- Restore discipline in classrooms
- According to the Center’s Thinking Minnesota Poll, the number one identified problem facing Minnesota’s public schools is discipline. With racial quotas in discipline policies, teachers and students are finding themselves in chaotic classrooms where safety is a concern and learning is disrupted. Attempts to remedy the in-class disruptions and altercations by implementing “restorative justice” practices are putting students’ academic achievement and safety at risk. School leaders should re-evaluate these policies and consider whose interests they are putting first by adopting such “reforms.” Our teachers and students deserve better.
- Learn from other states
-
- As previously discussed, Mississippi, of all places, is proving that how money is spent matters far greater than how much is spent. As one of the lowest spending states, Mississippi is helping its students of color improve academically far more efficiently than Minnesota. The state has focused funds on instruction and literacy programs and making sure its teachers understand the science of reading. And it has paid off. According to 2019 NAEP test results, Mississippi ranked #1 in the nation for significant gains in core subject areas, continuing its 10-year trend of steady increases, while other states—Minnesota included—and the nation’s scores stagnate or decline.
- Florida, as well, has focused on enacting specific K-12 education reforms, versus repeating ever-increasing spending, that have resulted in meaningful improvement. These reforms include: public and private school choice, virtual education, performance-based pay for teachers, grading of schools and districts, curbing social promotion, and alternative teacher certification. As a result, Florida’s Hispanic and black students outscore many statewide reading averages for all students.
-
This isn’t to say these state education systems don’t have room for growth nor does this mean that everything Minnesota is doing isn’t working. But one thing is clear: pouring more money into our public school system has not resulted in improved academic outcomes or meaningful progress in closing the achievement gap. Successful education reform efforts are underway in numerous states across the country, and it is time for Minnesota to pursue alternatives to the status quo for the sake of all our students.