Minnesota’s Budget Deficit: Tax revenues do not appear to be driven by tax rates
Yesterday, Minnesota Management and Budget forecast a surplus of $641 million for the FY 2020-21, which ends next June, but a deficit of $1.273 billion for FY 2022-23. This next biennium is the main job of the upcoming 2021 session. As we explained on Monday when we launched our new paper Minnesota’s Budget Deficit: Why we should make spending cuts and not raise taxes, the state constitution requires a balanced budget each biennium. Lawmakers in St. Paul must ask themselves the question: how will we close this deficit? They will have three options: higher tax rates, lower spending, or some combination of both.
Tax revenues do not appear to be driven by tax rates
If the state government attempts to close the deficit by hiking tax rates, historical experience suggests it won’t succeed.
When a state government raises a tax rate it is attempting to appropriate a greater share of the income generated by that state’s residents for itself. So, if higher income tax rates, for example, achieve their aims, we would expect to see an increase in the share of the state’s Gross Domestic Product (GDP) taken in income tax following a tax hike.
As Figure 1 shows, that does not seem to be the case in Minnesota. This shows the state’s top rate of state income tax for a single filer and the share of the state’s GDP taken in income tax. What is striking is how stable the share of state GDP paid in income tax is: both the mean and the median average for the period 1974 to 2018 are 2.8 percent. This is despite state tax policy. In the 1970s and into the 1980s, Minnesota’s politicians tried to claim a large share of their citizen’s income with top rates of tax of up to 17.0 percent. But Minnesotans did not respond to these rates by handing over a greater share of their money, as shown by the stability of the revenue line. Indeed, they handed over a larger share of their incomes to the government in the 1990s, with top income tax rates of 8.50 percent, than they did in the 1970s, when rates were 17.0 percent.
Figure 1: State income tax revenue as a share of state GDP and top rate of state personal income tax
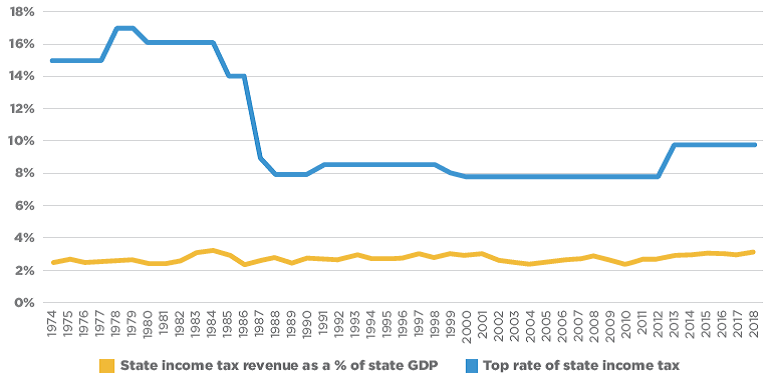
Source: Minnesota Department of Revenue and the Bureau of Economic Analysis
The same is true of revenue more broadly as Figure 2 shows. For total state tax revenues as a share of state GDP, the mean average is 6.6 percent and the median is 6.7 percent: in other words, there is very little variation in these numbers in spite of very different tax rates.
Figure 2: Total state tax revenue as a share of state GDP
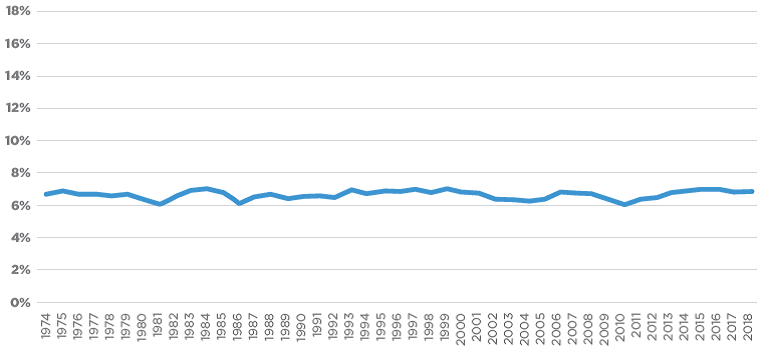
Source: Minnesota Department of Revenue and the Bureau of Economic Analysis
There is an important policy lesson here. The dollar amount of tax revenue seems far more likely to be a function of the size of the state’s economy than of its tax rates. This means that if you want more money to fund government services, you should look to increase the state’s GDP rather than hike its tax rates.
John Phelan and Martha Njolomole are economists at the Center of the American Experiment.