Wind Energy Fails: Grading the Reliability of Energy Sources During the Texas Power Outages
Commentary surrounding the Texas power outages has been wide-ranging, making it relatively difficult to make sense of what happened.
Here were the major factors contributing to the energy crisis:
- Because Texas doesn’t “winterize” its electricity infrastructure, around 45 gigawatts (GW) of generating capacity became inoperable the morning of February 15, 2021, due to extreme weather. Included in this capacity was:
- 30 GW of fuel-based energy sources (mainly natural gas) that became unable to produce electricity due to frozen natural gas pipelines and safety mechanisms that shut down nuclear and coal facilities to protect against extreme cold temperature. This is nearly 30 percent of all nuclear, coal, and natural gas capacity on the Texas grid.
- 15 GW of wind energy that could not generate electricity due to wind turbines freezing. This is roughly 50 percent of all wind and solar capacity on the Texas grid.
- Because neighboring states and Mexico were also experiencing energy emergencies of their own, in addition to the independent and isolated nature of the electrical grid in Texas, electricity imports were largely out of the question to mitigate the significant loss of generating capacity.
Renewable energy advocates were quick to come to the defense of wind and solar energy sources, while others were quick to blame them for the energy emergency that unfolded in the Lone Star State.
With so many competing narratives floating around, it’s helpful to see the data. As such, we created a reliability grading scale designed to judge which energy sources came to the rescue, and which ones were largely no-shows, during the statewide power outages that rocked Texas.
Reliability-Based Grading Scale
When it comes to power outages of this scale during a winter storm, all that matters to the millions going without power and heat is which energy source can provide immediate relief and bring the lights back on.
This is important to consider, as many in the media were applauding wind turbines for “over-performing” forecasts made the day before. However, over-performing forecasts means little to those going without electricity if the forecast was essentially nothing to begin with – which was the case in Texas heading into the emergency crisis. If I were to “forecast” the Vikings to win zero games in the 2021-22 football season, I wouldn’t be celebrating a record of 1-15 simply because they did better than my prediction.
This fact is lost on advocates for renewable energy, who in recent years have attempted to normalize the lack of performance for intermittent energy sources during energy emergencies in Minnesota, California, South Australia, and now Texas.
Therefore, we based our grading scale on reliability, as opposed to historical output or meaningless forecasts.
For our grades, we looked at electricity generation data provided by the Energy Information Administration (EIA) during the energy crisis in Texas – from 3:00 A.M. Monday morning to 12:00 A.M. on Wednesday – and compared them to the following reliability grading scale based on capacity factors.

Capacity factors are a metric showing how much available capacity was producing electricity during a given timeframe. For example, in a one-hour period on Monday morning, wind energy produced 649 megawatt-hours (MWh) of electricity out of a potential of 28,064 MWh that could have been produced. Thus, wind energy during this one-hour interval had a 2.3 percent capacity factor – a score of an F on our reliability grading scale.
For our grades, we used average capacity factors over the course of the Texas power outages to showcase which energy sources were performing the best, and which ones were non-factors. The graph below displays these capacity factors.
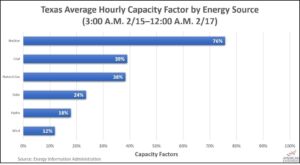
As you can see, the top three performing energy sources during the energy crisis in Texas were all fuel-based energy sources: nuclear, coal, and natural gas. On average, these three energy sources alone provided over 91 percent of all electricity generated throughout the energy emergency, as the graph below shows. Without these energy sources on the grid providing the bulk of electricity, the situation in Texas would have gone from bad to worse.
Remarkably, natural gas still generated electricity at 38 percent of its total capacity throughout the energy emergency – providing on average over 65 percent of all electricity generation through Monday and Tuesday – despite roughly 30 GW being inoperable due to frozen pipelines holding up fuel. This means that the natural gas facilities that could still receive fuel were operating at capacity factors of more than 62 percent.
The three worst-performing generating assets, on the other hand, belonged exclusively to renewable energy sources: solar, hydro, and wind. Had Texas been even more reliant on these energy sources, as renewable energy advocates around the country desire, the energy crisis in Texas would have been even worse.
Based on these capacity factors, reliability grades during the Texas power outages are:

Nuclear scored the highest grade of an A, followed by natural gas and coal with C’s. Solar was the only renewable energy source to score higher than an F with a grade of a D, while hydro and wind scored F’s.
Grading the Highest One-Hour Capacity Factors of Each Source
Now that we graded the average capacity factors for each source, it’s now time to score each source according to their highest and lowest one-hour capacity factors during the energy crisis in Texas.
Why do this? Because some energy sources, such as solar, work very efficiently during certain times of the day, which provides a degree of reliability when the sun is shining. Even wind can, at times, produce electricity fairly efficiently (if and only if the wind is blowing, which isn’t as much of a for sure thing as the sun rising and falling). As you can see from the graph below, however, this was not the case during the energy crisis in Texas.
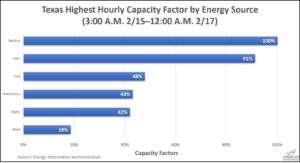
As you can see, wind energy in Texas only managed to produce a maximum of 19 percent of total potential output during the entire energy emergency in Texas. Wind energy is the second most abundant energy source in Texas in terms of capacity with over 28 GW – or nearly 21 percent of all capacity in Texas. The fact that at least 81 percent of this capacity sat dormant during a time when Texans needed electricity the most is simply inexcusable.
Comparatively, all other energy sources produced a high of over 40 percent of their total potential – even natural gas, despite 30 GW of natural gas capacity unable to receive fuel.
Based on the highest one-hour capacity factors for each energy source throughout the energy crisis, the grading scale is as follows.

Nuclear and solar scored A’s, natural gas, coal, and hydro took C’s, and wind energy once again took a grade of an F.
The Lowest
In a similar fashion, there are times when some energy sources produce little to no electricity at all. In the case of solar, when the sun goes down, it stops producing electricity altogether, as shown in the graph below. As you can imagine for millions of Texans who spent the night with no electricity (which I was one of), it didn’t matter how efficient energy sources like solar were during the day. They needed immediate relief from the energy emergency, and couldn’t wait for the morning.
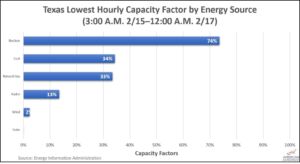
In addition, notice that wind energy had a low capacity factor of only 2 percent, while the low for natural gas, coal, and nuclear was 33, 34, and 74 percent, respectively.
Based on one-hour low capacity factors, reliability grades are:

This was the only category in which nuclear scored a grade lower than an A (although only by 1 percent).
Coal and natural gas followed nuclear with grades of D’s, while all three renewable energy sources scored grades of F’s.
Fuel-Based Energy Sources Passed, While Wind Energy Failed
In case you missed it, wind energy scored an F in all three categories – the only energy source to perform so poorly during the power outages in Texas.
As such, you can rightfully label wind energy as the most unreliable energy source during the Texas energy crisis. While it may not have been the primary cause of the power outages, it certainly wouldn’t have done Texas any good to have more wind capacity on the system than fuel-based energy sources. In fact, that would have only made things worse.
More nuclear power, on the other hand, would have made the world of difference, as it was the most reliable energy source on the grid during the energy crisis and by a large margin. Unfortunately, Texas only has about 5,400 MW of nuclear capacity on the grid – making up just under 4 percent of total capacity in Texas.
While coal and natural gas didn’t do nearly as well, they still passed with C’s. Furthermore, because Texas has nearly 20 GW of coal capacity and over 77 GW of natural gas capacity, a C effort still led to natural gas and coal being the largest suppliers of electricity throughout the energy emergency.
If this grading scale tells us anything, it’s that relying on intermittent renewable energy during extreme weather events is not the answer to maintain reliability, and fuel-based energy sources are required in order to keep the lights on.