How have federal taxes changed for different income groups historically?
Earlier this month, the Congressional Budget Office released a report analyzing changes in income, benefit payments, and federal taxes by income group.
And contrary to popular opinion that the rich do not pay their fair share; CBO data shows that high-income Americans have consistently paid higher taxes. Not only that, taxes for the rich, particularly those in the top 20 percent, have gone up considerably.
Here is a look at some of the charts showing tax changes between 1979 and 2017.
Taxes have fallen the most for low-income individuals
On average tax rates, the CBO states that
average federal tax rates declined most sharply among households in the lowest quintile, falling from a peak of 12.1 percent in 1984 to 1.3 percent in 2017.
Middle-income individuals also experienced a tax cut but to a smaller extent compared to low-income individuals. Higher-income taxpayers saw a more volatile movement in taxes, with some experiencing tax hikes. 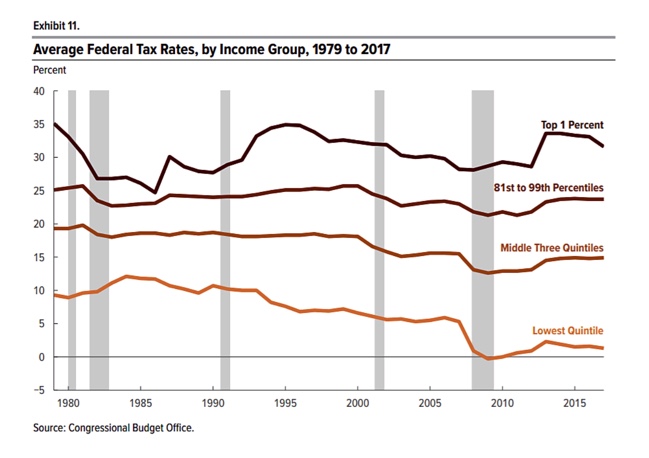
Share of federal taxes
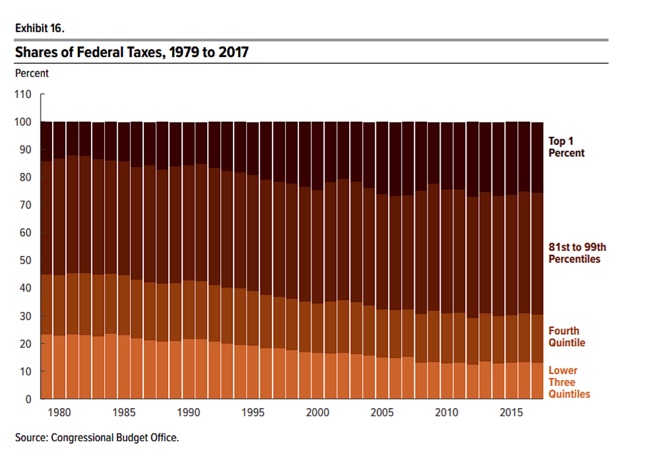
According to the CBO,
The share of federal taxes paid by households in the highest quintile increased from 55 percent in 1979 to 69 percent in 2017. That group’s share of income before transfers and taxes also increased over the period, although to a lesser extent than its share of federal taxes. Most of that 14 percentage-point increase in the federal tax share occurred in the top 1 percent of the distribution, whose share of all federal taxes rose by 11 percentage points, from 14 percent in 1979 to 25 percent in 2017. Those households’ share of income before transfers and taxes also rose, although to a lesser extent, from 9 percent in 1979 to 17 percent in 2017.
The US tax code, especially for income taxes is progressive and has become increasingly so. The rich hold a high and growing share of federal income taxes.