August employment report: Minnesota’s job growth is concentrated in lower productivity sectors
“There are three kinds of lies: lies, damned lies, and statistics”, as the 19th century British Prime Minister Benjamin Disraeli is supposed to have said. Minnesota’s recent employment data would seem to bear him out.
What’s going on?
Official data released last Thursday shows that in August, Minnesota lost 6,600 jobs. In addition, our state’s Department of Employment and Economic Development (DEED) said that it overestimated July’s gain of 7,700 jobs by 5,100. As a result, the state’s unemployment rate edged up from 3.7% to 3.8%. This remained below the national average, which also ticked up from 4.3% to 4.4%.
But, back in July, June’s figures, which initially showed an increase of 4,900 jobs, was revised upwards to 9,300. The reason is, as the Star Tribune noted, that
The state’s monthly jobs data is notoriously volatile and subject to revision, in part because it is being generated from a relatively small base of 3 million. Viewed over several months, the data gives a more reliable picture of overall momentum in the Minnesota economy.
Short and longer term trends in Minnesota’s jobs
From July to August, as Twin Cities Business reports,
The largest drop came from the leisure and hospitality industry where 6,400 jobs were cut. Education and health services also posted a significant loss (down 5,300). Cuts also occurred in the other services sector (down 800) and construction (down 400).
Employment in the logging and mining industry remained unchanged.
Where the state gained the most jobs in August was among trade, transportation and utilities businesses (up 3,200), followed by manufacturing (up 800), professional and business services (up 800), government (up 800), information (up 500), and financial activities (up 200).
Looked at over the last year, however, the picture is somewhat different. The leader in jobs growth since August 2016 has been Educational and Health Services followed by Construction and Leisure & Hospitality. Two sectors have lost jobs over the last year, Financial Activities and Information.
What do the trends mean?
These longer term trends do not bode well for Minnesota’s economic future.
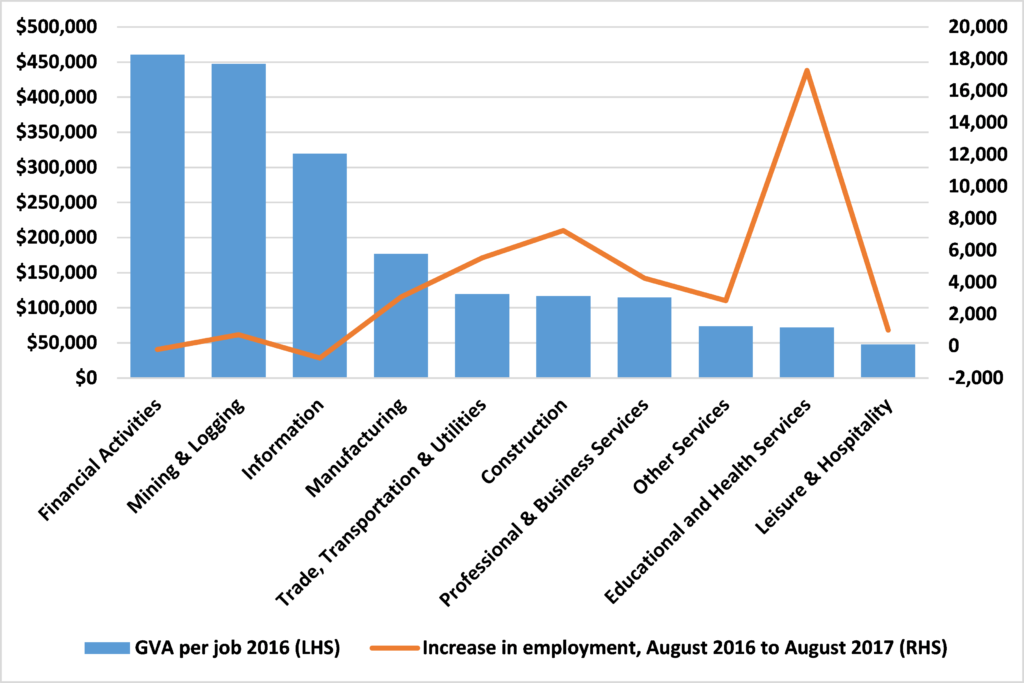
The amount of Gross Value Added (a measure of economic output) annually per job in Financial Activities and Information is $460,770 and $319,596 respectively. These are the two industrial sectors which have shed jobs over the last twelve months. By contrast, in the three sectors to have added most jobs, Educational and Health Services, Construction, and Leisure & Hospitality, the annual amount of Gross Value Added per worker is just $72,408, $116,832, and $47,986 respectively.
In short, as the chart below shows, over the last year Minnesota has gained the majority of its jobs in lower productivity sectors.
To repeat, this is in no way to denigrate jobs in these sectors. Health and education are vital. But to have high quality hospitals and schools and to be able to afford that week in the cabin Up North, we need high productivity, high wage jobs. This is key for the state’s economic future. While the last month’s figures move in this direction, the longer term trends ought to be cause for concern.
John Phelan is an economist at Center of the American Experiment.