Business friendly policies spur stronger growth in counties across Minnesota’s border
 A forthcoming article in American Experiment’s magazine, Thinking Minnesota, will reveal the grass is growing greener on the other side of Minnesota’s border. For the article, I analyzed job growth in counties on either side of the state’s border and found jobs are growing at a faster pace in counties just outside Minnesota.
This comparison adds another strong piece of evidence to show that Minnesota’s tax and regulatory policies stifle growth. Growth along Minnesota’s border is strongest where taxes and regulations are the least burdensome.
Researchers are increasingly comparing economic activity along state borders to help identify how differences in state policy impact the economy. Comparing border counties helps isolate the impact of state policies from other factors that impact a state’s economic performance. Labor pools, educational attainment, transportation networks, access to markets and cultural dynamics are generally quite similar on either side of a state border. What’s different is state policy.
This review of job growth on either side of Minnesota’s border over the past fifteen years shows stronger job growth in counties with lower taxes and less burdensome regulations in the Dakotas and Iowa.
Based on the Tax Foundation’s measure of state and local tax burden for fiscal year 2012, Minnesota’s tax burden ranked eighth. The tax burdens in Iowa, North Dakota, and South Dakota ranked 31st, 33rd, and 49th respectively. Wisconsin, by the way, ranked fourth highest. Though Scott Walker has been their governor since 2010, Wisconsin still shares Minnesota’s history of blue state policy.
The regulatory environment is also clearly more business friendly across the border. The recent failure to permit the Sandpiper pipeline across northern Minnesota contrasts starkly with the permitting process on the other side of the border. Last August I added up the elapsed time in permitting the Sandpiper pipeline and compared that timeline to the how long it took to permit the Dakota Access Pipeline through North Dakota, South Dakota, Iowa, and Illinois. Minnesota was at 1,001 days and counting. By comparison, the Dakota Access Pipeline—a pipeline that started the permitting process a year after the Sandpiper—was already being built. Each state on Minnesota’s border permitted that pipeline in 498 days or less.
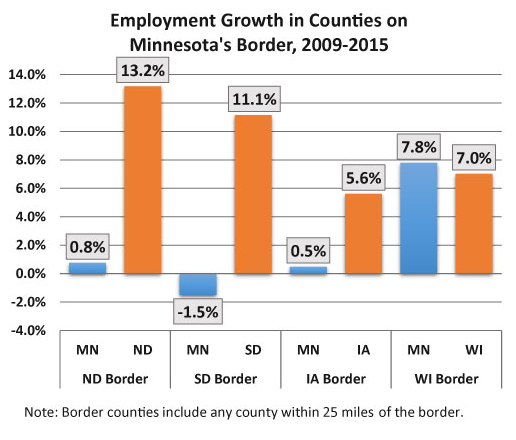
For the magazine article, I focused on job growth over the past fifteen years. But a look at growth since the bottom of the recession is also revealing. It’s well known that Minnesota gained jobs back after the recession faster than most other states, but the figure below—a figure that didn’t make the cut for the article—again shows a growth advantage on the Dakota and Iowa side. And growth on the Wisconsin side is not that far behind Minnesota.
As I note in the article, the stronger growth on the Iowa side might be the most revealing because those counties are the most comparable to Minnesota. Most of the counties have lower population densities and none of them host a major city. Iowa beats Minnesota, which is all the more remarkable considering there is one major difference between these border counties. Most of the Minnesota side has an Interstate cutting through it, which should attract more economic activity.
Why doesn’t Minnesota attract more economic activity? With so much the same on either side of the Minnesota’s southern border, Iowa’s lower tax and regulatory burden makes the difference.