COVID-19 shutdown hasn’t resulted in better air quality, Minnesota air monitoring data shows
News outlets like National Geographic and CNN are running stories talking about how Coronavirus-related economic shutdowns are resulting in better air quality in some cities around the world. While cities like New Delhi, Seoul, Wuhan, and Los Angeles have seen improvements in air quality resulting from widespread economic shutdowns, this same trend has not been observed in Minnesota, according to data collected by air quality monitoring stations.
In fact, the data show that concentrations of small particles, often referred to as PM2.5, have been higher during the dates of the shutdown than they were in previous years despite the fact that the Shelter-In-Place order has resulted in a dramatic drop in the number of people driving on Minnesota roads, and also a widespread closure of businesses.
Monitoring Data Show Higher Levels of Small Particulates During the Shutdown
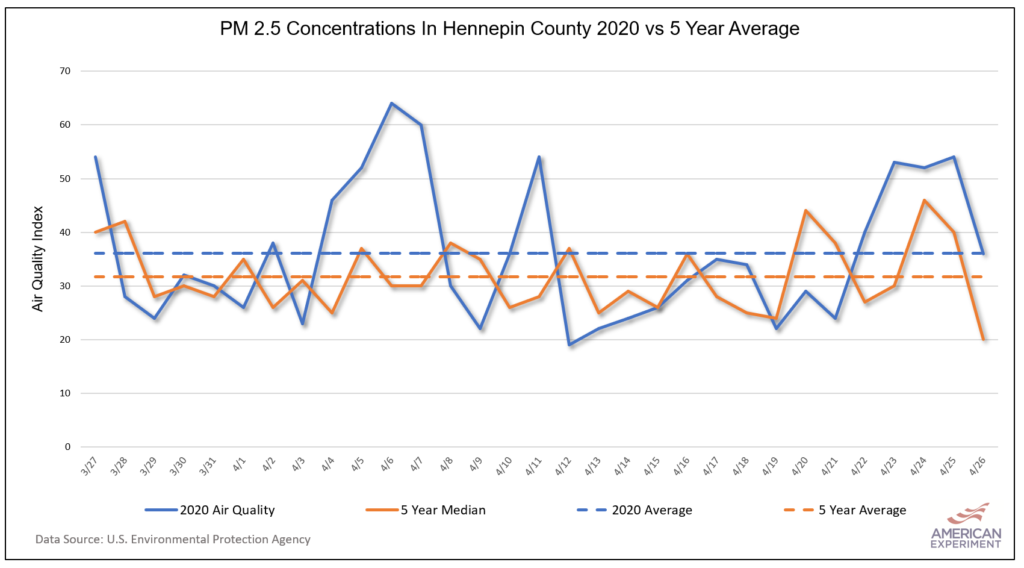
The graph below uses data obtained at the United States Environmental Protection Agency (EPA) website, and it shows the concentration of these small particles in Hennepin County compared to the five year mean. As you can see, concentrations of small particles in the air from March 27th, the day Governor Walz issued the Shelter-In-Place order, through April 26th, were actually higher than the five year average concentrations on these same dates.
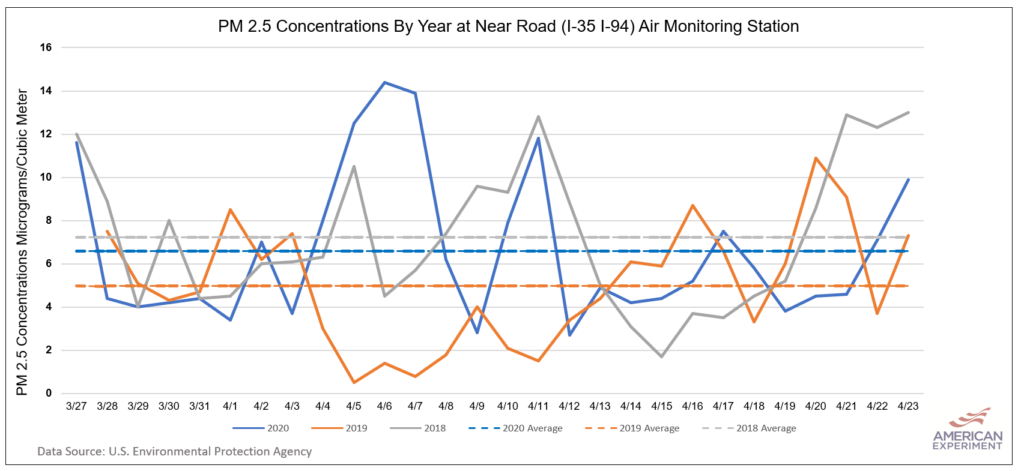
Similar trends can be seen at individual air monitoring stations as well. For this analysis, we examined the Near Road monitor near Interstate 35 and Interstate 94 because it is near these two major roadways. If a monitoring station were to register a decline in particulates due to reduced traffic, it should be most evident here.
The data show that PM 2.5 concentrations during the Coronavirus shutdown were approximately 32 percent higher than 2019 levels during the same time period, but that 2018 levels were approximately 9.5 percent higher than 2020. As a result, the data suggest that factors other than human activity, such as regional weather patterns, wind speed, humidity, and temperature, are primarily responsible for regional air quality during any given time frame.
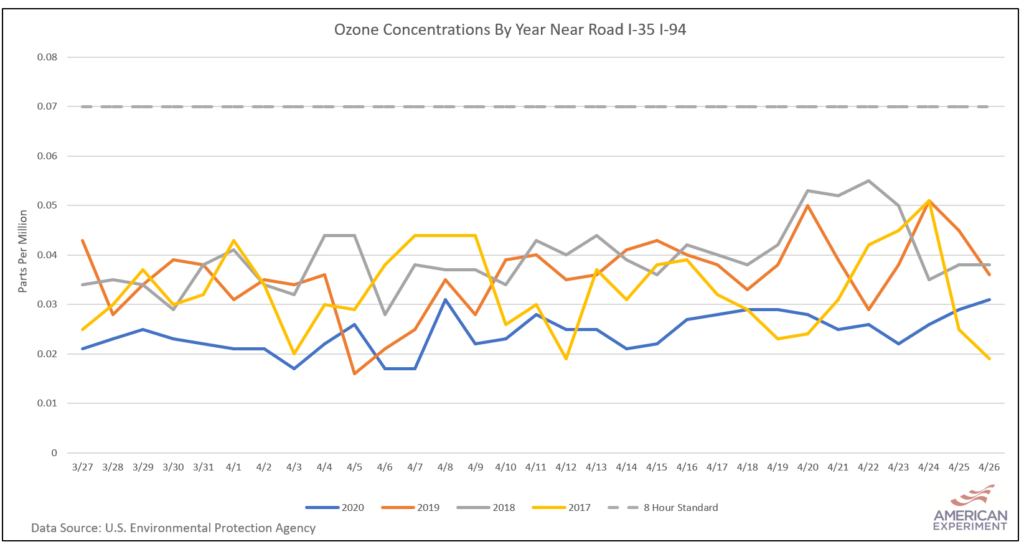
The case was different for Ozone, however. The graph below shows that Ozone concentrations measured at the Near Road monitor were the lowest in 2020 out 2019, 2018, and 2017. According to EPA, variations in weather conditions play an important role in determining ozone levels. Daily temperatures, relative humidity, and wind speed can affect ozone levels. In general, warm dry weather is more conducive to ozone formation than cool wet weather.
Increasing PM 2.5 During A Dramatic Drop Off in Traffic
Minnesota Public Radio reported that traffic was down by about 50 percent from March 27th through April 9th, when it wrote a story about how traffic fatalities had increased despite fewer drivers on the road. During that period, the fact that Minnesota saw a large spike in PM 2.5 concentrations is noteworthy considering the greatly reduced levels of traffic. But why did PM 2.5 levels spike?
I emailed Daniel Dix, who is a meteorologist at the Minnesota Pollution Control Agency, and asked if he might have some insight as to why PM2.5 would be higher during this time period. He attributed the uptick in PM 2.5 to a controlled burn in Kansas, as well as an increase in backyard recreational fires.
Conclusion
The data from abroad and Minnesota indicate that areas with poor air quality tended to see their air quality improve during Coronavirus-related shutdowns, but this trend did not hold true for Minnesota, which already has air quality that meets all federal air quality standards.