Data show that Minnesota’s employment has declined most among 20 to 24-year-olds – fifth biggest fall in the U.S.
Last week I wrote about data showing that the number of people out of the labor force since the pre-pandemic peak has seen its 13th greatest increase in Minnesota.
One respondent said that the article was “fundamentally dishonest” because it didn’t account for those who had “left the workforce permanently due to *retirement*…those who left the workforce *temporarily* to care for sick/aging parents [and]…those who can’t find affordable child care…”
Of course, as I’ve noted before, all this does is beg the question of why these various problems are worse in Minnesota than they are in other states: Why are there so many more people retiring in Minnesota? Why are there so many more people caring for sick and aging parents in Minnesota? Why is it so much harder to find affordable child care in Minnesota?
This did prompt me to take a closer look at the data, however. The Bureau of Labor Statistics (BLS) breaks the labor force down into various categories. We can compare the numbers for these categories for 2019 to 2022 to see how some of the components of Minnesota’s workforce have changed.
Figure 1 shows the percentage point change in the employment ratio (the share of a given component actually employed) from 2019 to 2022. We seer that the overall employment ratio is down by 1.3% over the period, which is what we’d expect to see given that Minnesota is one of only 13 states not to have regained its pre-pandemic number of private sector jobs.
Figure 1: Percentage point change in employment ratio, 2019 to 2022
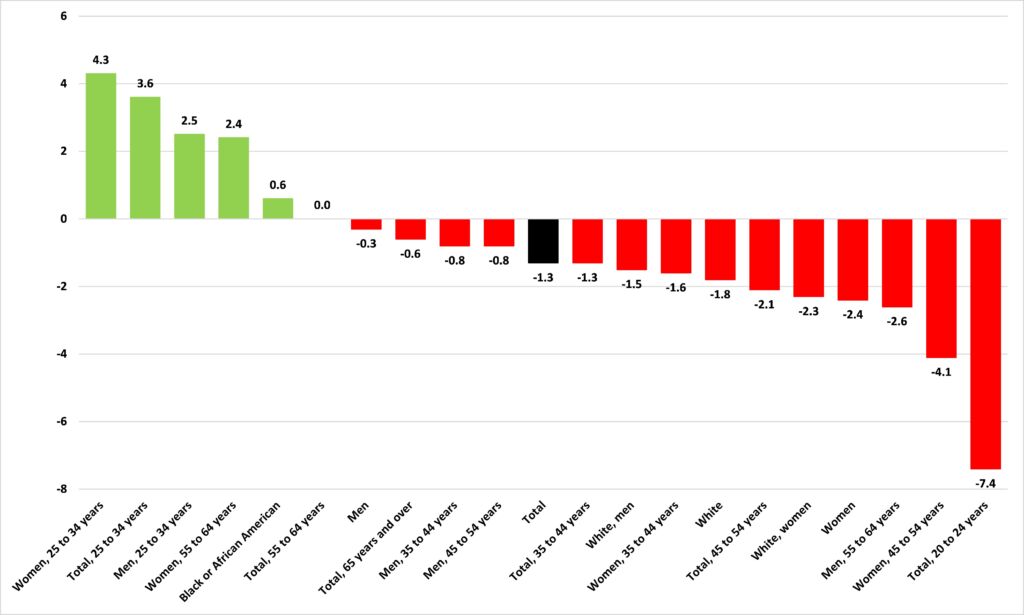
But look at the components. On the left, in green, are those where the employment ratio increased between 2019 and 2022, with ‘Women, 25 to 34 years’ leading the way with an increase of 4.3 percentage points in their employment ratio. But over on the right, in red, we see that the component of Minnesota’s labor force with the steepest fall in its employment ratio is ‘Total, 20 to 24 years,’ whose employment ratio fell by 7.4 percentage points from 2019 to 2022. These are younger Minnesotans, who should be accumulating skills and entering the prime of their working lives. In reality, the number of 20- to 24-year-old Minnesotans not in the labor force increased by 25,000 between 2019 and 2022, a 41% increase, which was the largest of any of these components.
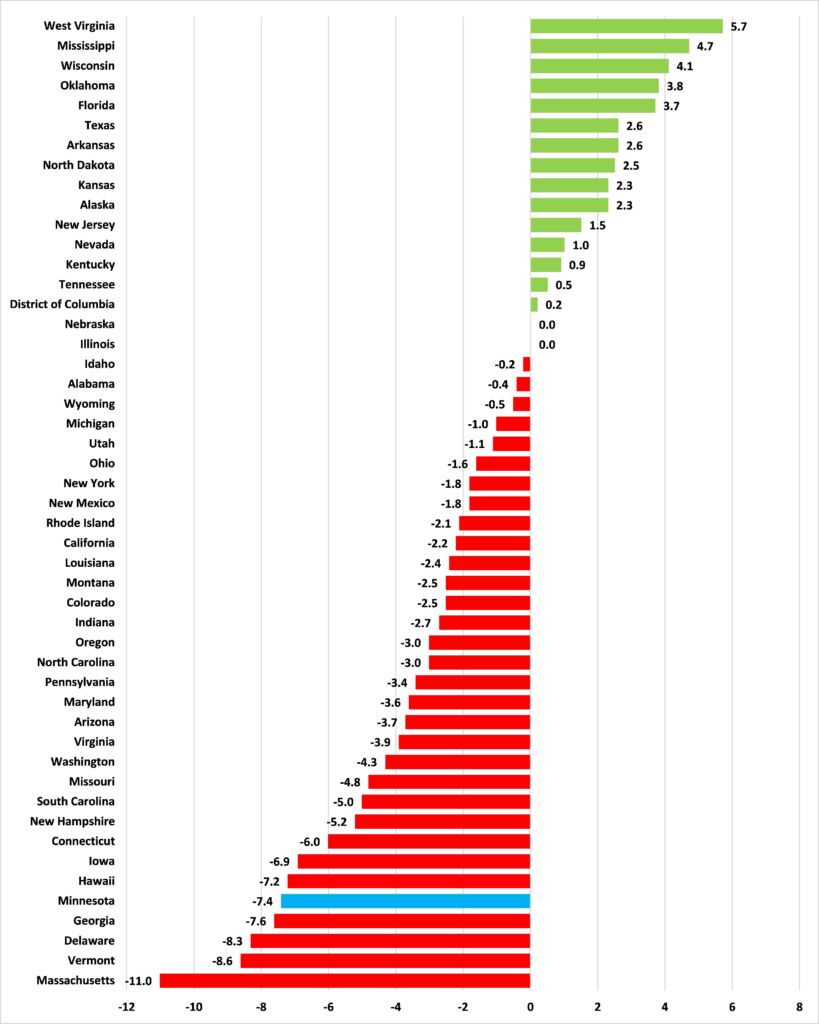
To put this in context, Figure 2 shows the percentage point change in the employment ratio for 20- to 24-year-olds for 49 states and the District of Columbia (Maine’s numbers for 2022 aren’t in) between 2019 and 2022. Fourteen states — including Ron DeSantis’ Florida — and the District of Columbia have seen their employment ratio for 20- to 24-year-olds increase from 2019 to 2022. Not only is Minnesota one of the 32 states that saw its employment ratio for 20- to 24-year-olds fall from 2019 to 2022, its fall — 7.4 percentage points — was the fifth worst in the United States.
Figure 2: Percentage point change in employment ratio, 20- to 24-year-olds, 2019 to 2022
Whichever way you slice it, the data show that Minnesota’s labor market is faring as relatively weakly as its economy generally.