Data show that number of people out of the labor force since pre-pandemic peak has seen 13th greatest increase in Minnesota
Last week I noted that Minnesota is one of only 13 states not to have regained its pre-pandemic number of private sector jobs. This came after the state lost 5,700 jobs in March even while its unemployment rate declined. How is that possible?
The unemployment rate is calculated by dividing the number of people who are unemployed but looking for work by the total number of people in the labor force. Crucially, people who are unemployed and not looking for work are not counted in the labor force. Because of this, it is possible for the unemployment rate to fall without the number of people employed rising if people simply give up looking for work. So, to properly assess the employment situation in Minnesota we need to look at three things: changes in the number of people unemployed, changes in the number of people employed, and changes in the number of people not in the labor force at all. [Emphasis added]
To understand what is going on in our labor market, we have to look at these three numbers.
Unemployed
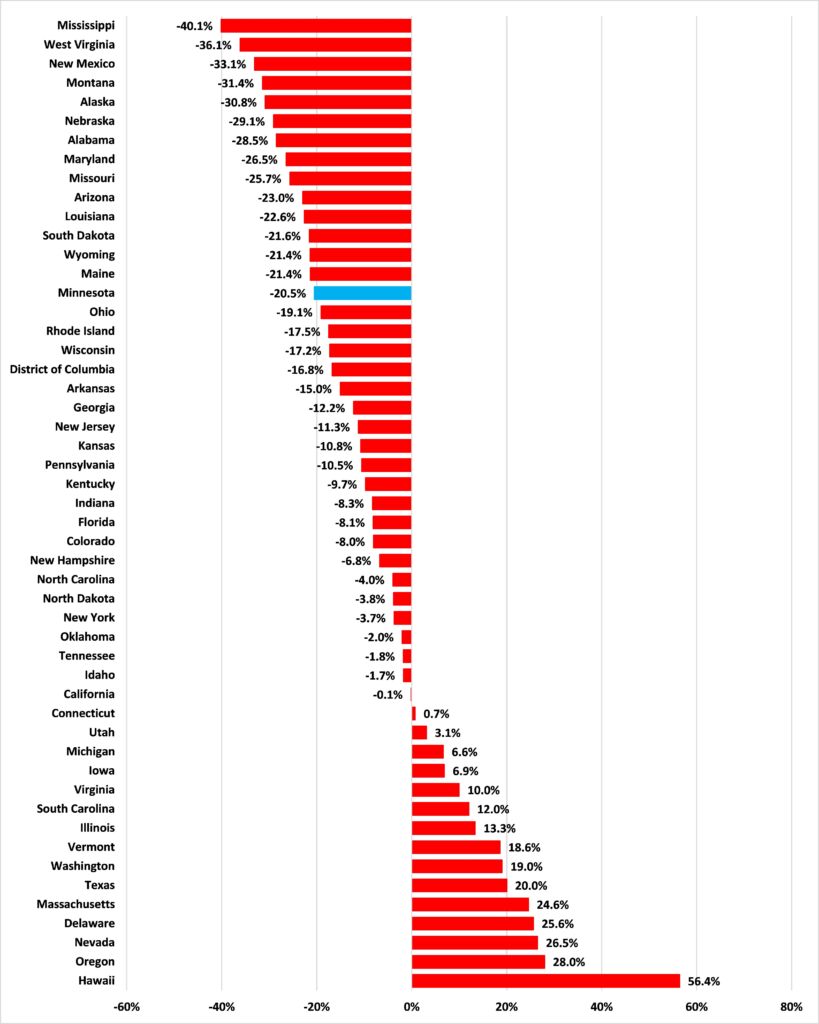
BLS numbers show that Minnesota is actually one of 36 states and the District of Columbia with fewer people unemployed in March 2023 than were unemployed at the pre-pandemic peak for employment in the United States in February 2020, as Figure 1 illustrates. This would seem to be good news.
Figure 1: Change in total unemployed, February 2020 to March 2023
Employed
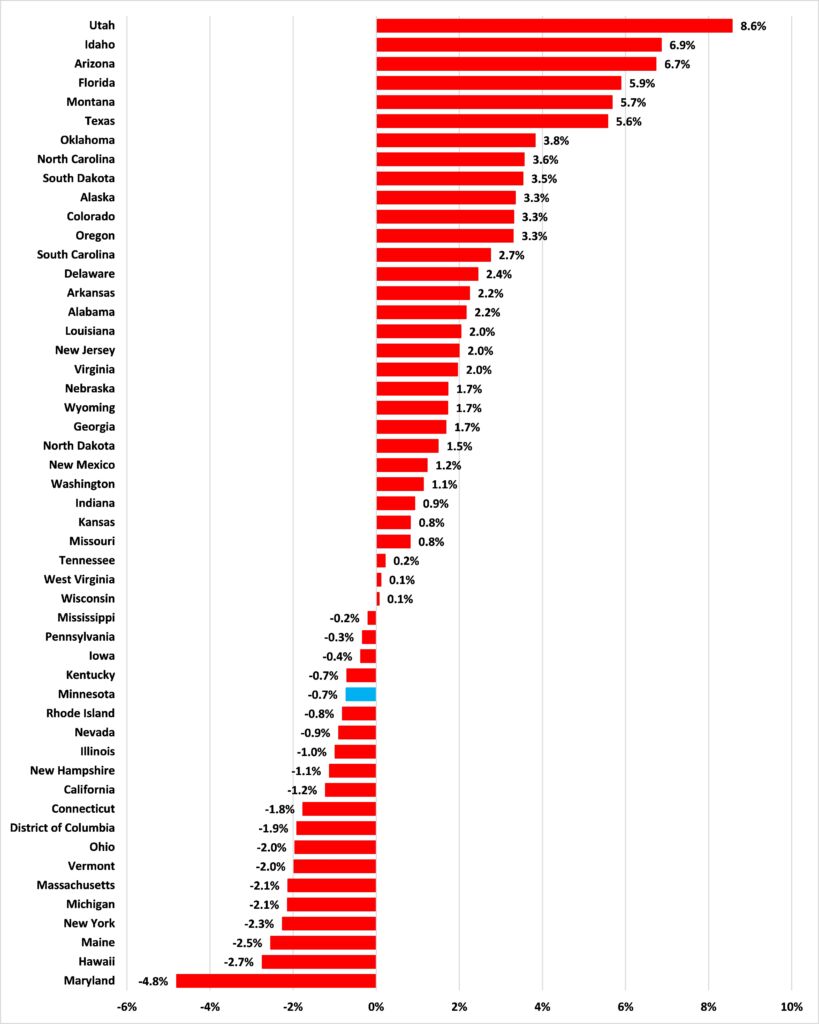
But this decline in total unemployment is not the result of increased employment. Indeed, as Figure 2 shows, Minnesota had 0.7% fewer people employed in March 2023 than it did in February 2020. Our state was one of 20 jurisdictions that has fewer people employed now than before COVID-19 hit.
Figure 2: Change in total employed, February 2020 to March 2023
Not in the labor force at all
So, to account for a fall in the number of people both unemployed and employed we have to look at the number of people who have left the labor force completely. We can calculate this by subtracting the number of people in the labor force from the number for the civilian non-institutional population.
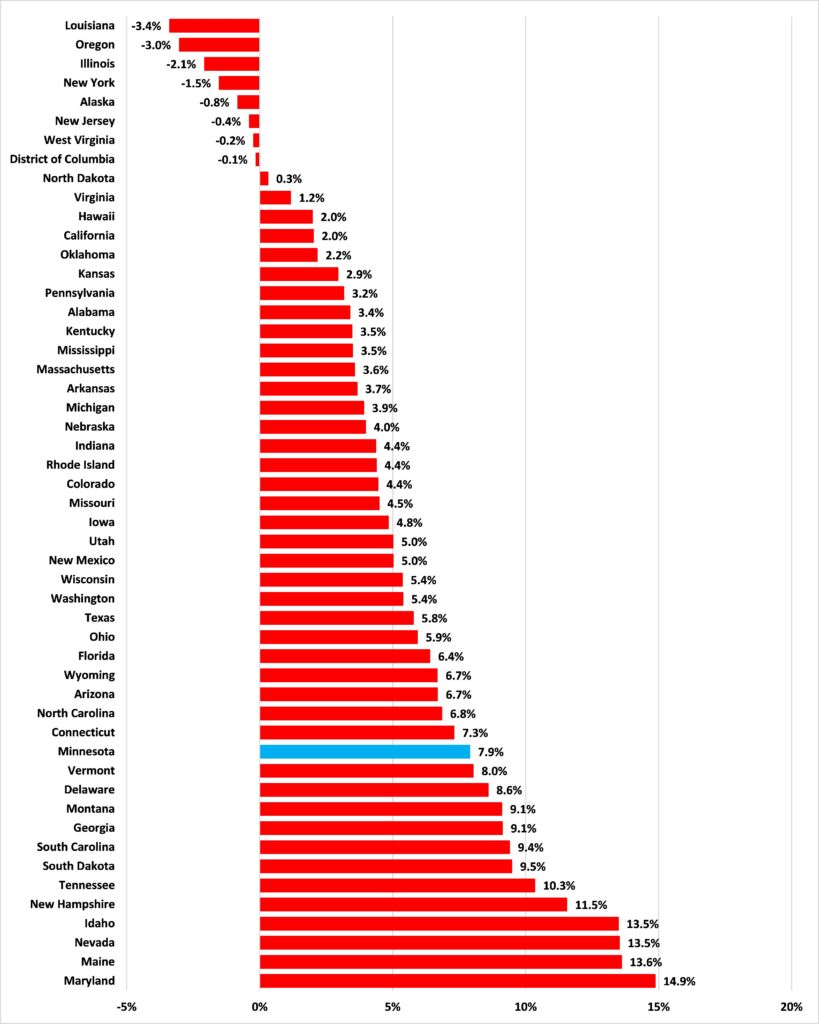
Figure 3 shows that the number of Minnesotans who are not in the labor force at all increased by 7.9% between February 2020 and March 2023: this is the 13th largest increase in the United States. This would seem to be bad news.
Figure 3: Change in total not in the labor force at all, February 2020 to March 2023
Telling the truth about the labor market
Last week’s post generated some discussion on social media, not all of it well informed (no, Minnesota does not have the “Lowest unemployment rate of any state in history,” there were 14 states with lower unemployment rates in March 2023). These numbers show us that Minnesota’s unimpressive record on post-pandemic employment does not “have something to do with historically low unemployment rates,” it is to do with people packing in working or even looking for work. One correspondent asked: “With an unemployment rate like MN, who do you think will work those jobs you think we need?” Well, we could start with all those Minnesotans who have left the labor force completely.