Democrats’ $3.5 trillion spending bill would cut 2 million from private health coverage
The recent Congressional Budget Office (CBO) analysis of the cost and coverage impacts of the main health care provisions in the Democrats’ $3.5 trillion “Build Back Better” Act hides the long-term impact on coverage. A deeper dive into the CBO’s data shows the number of Americans with private health coverage is estimated to decline, on net, by nearly 2 million when the bill’s provisions are fully implemented.
The CBO provided their analysis in response to a request for information from Republicans in Congress. This analysis provides specific year-by-year estimates of the cost impact over the ten-year projection period from 2022 to 2031, but it only reports the annual average impact on health coverage over the same period.
The CBO’s response notes that they have still not completed a cost estimate for the entire spending bill. Understandably, with the tight time constraints and the massive amount of spending provisions to score, the CBO is likely still fine tuning their annual coverage estimates. Presumably, a more precise year-by-year estimate will be provided in the final score. In the meantime, there’s enough additional coverage data included in the CBO analysis to provide a rough estimate of the longer-term coverage impact which is outlined below.
Before getting into the longer-term impact, it’s helpful to first unravel the average annual impact on coverage from Build Back Better’s three main health care provisions. These three provisions would:
- Permanently increase Affordable Care Act (ACA) subsidies for individual health insurance market coverage by making subsidies more generous for lower-income people and extending subsidies to higher income people who earn more than 400 percent of the federal poverty level (FPL);
- Temporarily expand access to ACA subsidizes to low-income people with incomes below 138 percent of FPL from 2022 to 2024 and then permanently transition these people to a new federal Medicaid program in 2025; and
- Modify the employer-coverage affordability test to allow more people to qualify for subsidies on the ACA exchanges.
The chart below organizes the coverage impacts the CBO identifies for each of these provisions. It provides a matrix showing how each provision specifically impacts the number of people with Medicaid, subsidized individual market coverage, unsubsidized individual market, employer-sponsored coverage, and the number of uninsured. It’s not the clearest chart to follow, but it delivers a much clearer picture than the CBO’s text.
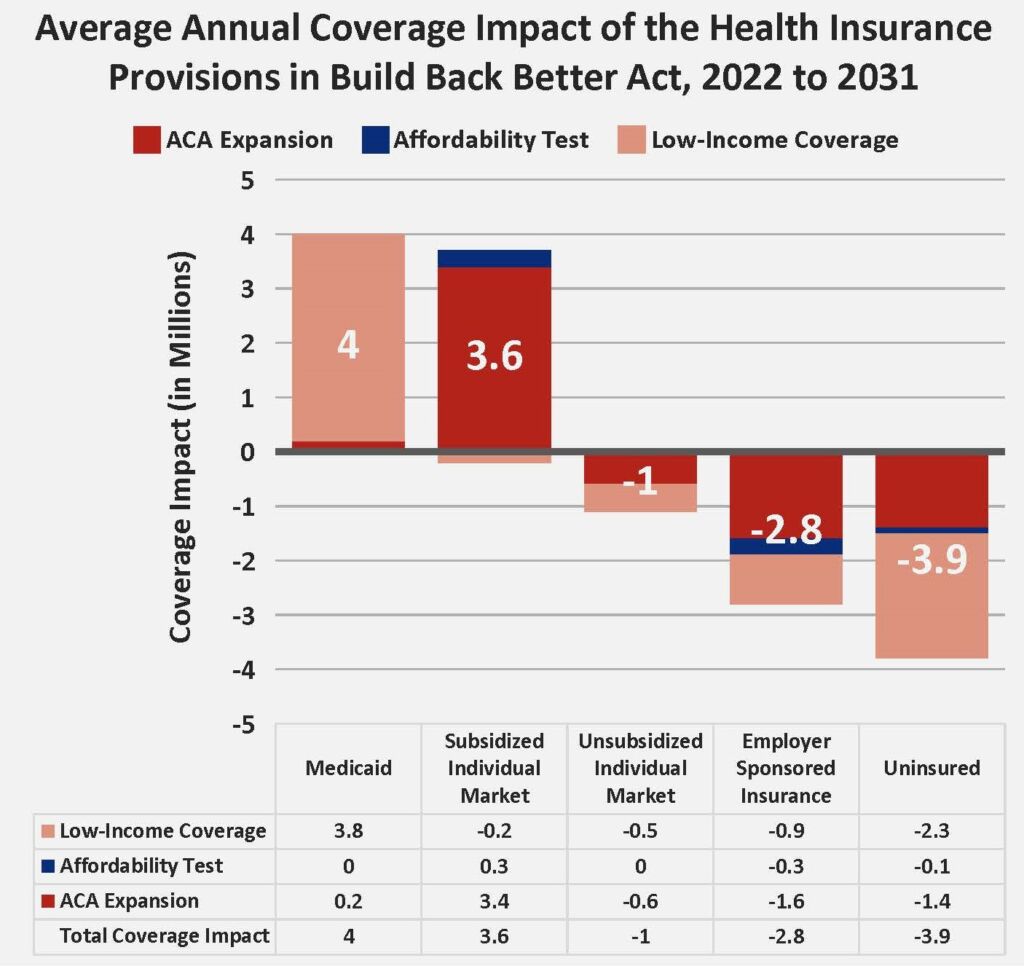
Note: “Total Coverage Impact” may not sum from the three provisions due to rounding.
This figure reports the average annual coverage impact that the CBO reports upfront in their summary. It shows a net decline in private coverage — the increase in subsidized individual market coverage minus the decline in unsubsidized individual market and employer-sponsored coverage — of around 200,000. However, looking at the annual average fails to account for the dramatic policy change that occurs in 2025, when the temporary individual market subsidies for low-income people ends and they move to a new federal Medicaid program. The upfront weight of low-income people getting subsidies for private coverage who shift to Medicaid in 2025 hides the eventual decline in private coverage that occurs after this shift.
Fortunately, the CBO did provide data that separates the coverage impacts for the temporary expansion of low-income premium subsidies from 2022 to 2024 and the Medicaid expansion after 2024. Separating these impacts and then recombining them with the impact of the other two provisions for each year provides a rough estimate of the long-term coverage impact. The following table outlines this coverage impact by year.
Annual Health Coverage Impacts of Build Back Better
| Medicaid | Private Individual Market | Private Employer Sponsored | Net Change in Private Coverage | Uninsured | |
| 2022 | 0.0 | 5.4 | -2.2 | 3.2 | -3.2 |
| 2023 | 0.0 | 5.4 | -2.2 | 3.2 | -3.2 |
| 2024 | 0.0 | 5.4 | -2.2 | 3.2 | -3.2 |
| 2025 | 5.8 | 1.2 | -3.0 | -1.8 | -4.0 |
| 2026 | 5.8 | 1.2 | -3.0 | -1.8 | -4.0 |
| 2027 | 5.8 | 1.2 | -3.0 | -1.8 | -4.0 |
| 2028 | 5.8 | 1.2 | -3.0 | -1.8 | -4.0 |
| 2029 | 5.8 | 1.2 | -3.0 | -1.8 | -4.0 |
| 2030 | 5.8 | 1.2 | -3.0 | -1.8 | -4.0 |
| 2031 | 5.8 | 1.2 | -3.0 | -1.8 | -4.0 |
Source: Author’s calculations based on CBO estimates. This table reflects the average annual coverage impacts for the 2022 to 2024 period and the 2025 to 2031 period to account for how Build Back Better would shift people from private individual health insurance market subsidies to a new federal Medicaid program in 2025.
Compared to the annual average coverage impacts the CBO highlights, this table reveals a much larger decline in private coverage and much larger increase in Medicaid coverage over the long-term when the $3.5 trillion Build Back Better provisions are fully implemented. While the annual averages show private coverage will on net drop by 200,000, private coverage drops by nearly 2 million after the Medicaid expansion is fully introduced. Medicaid enrollment increases to nearly 6 million compared to the average annual increase of 4 million the CBO highlights.
Employer-sponsored coverage declines by 3 million. That’s not much higher than the ten-year annual average the CBO highlights, but it does drive the net loss in private coverage. Many who lose employer coverage will not find comparable coverage on the individual market. In particular, people with pre-existing conditions will likely be exposed to much higher out-of-pocket costs.
Notably, individual market coverage, on net, only increases by 1.2 million and that’s despite an increase of 3.4 million due to making the ACA subsidy expansion permanent. Ultimately, the ACA subsidy expansion pushes 600,000 unsubsidized out of the market, the new federal Medicaid program pulls 1.9 million out of the market, and the modification to the affordability test adds about 300,000. This leaves an increase of just 1.2 million after the policies are fully implemented in 2025.
These individual market enrollment projections confirm that the Build Back Better Act would not build up and strengthen the individual market. Instead, it will push out the unsubsidized and leave the market with premiums so high that everyone who enrolls will need a subsidy. When everyone needs and receives a subsidy to enroll, there will be very little pressure on health insurance companies to control premium growth. The higher premiums rise, the more insurers profit from their 20 percent administrative cut. And, due to how premium subsidies are structured, taxpayers will pay the full cost for these premium hikes.
The CBO does not appear to have accounted for this inflationary dynamic and, therefore, their cost estimates are likely much too low. In the final score, the CBO needs to account for this inflation. Big insurance companies have all figured out how to profit from the ACA exchanges at the expense of the American taxpayer and the unsubsidized. This windfall to the insurance industry needs a full accounting.