Does Minnesota get value from state government?
The short answer is “no” when looking at three key measures.
Earlier in the week, I posted a pie chart of state government spending. The chart shows that just two line items account for about 70 percent of all state tax money spending.
Nearly 40 percent of the entire state budget goes to K-12 education. This state money supplements the local tax dollars collected by school districts through property taxes. Federal taxpayers contribute an additional amount each year.
The state contribution works out to about $6,800 per pupil, per year. Total spending works out to $14,378 per pupil, with inner-city districts spending more than $18,000 per student.
And how are the results?
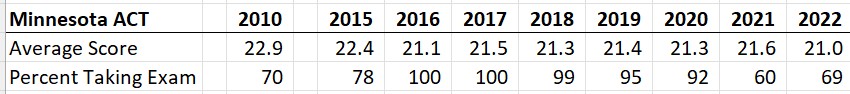
The average ACT score for graduation high school students is down 1.9 points since 2010. That may not seem like a big drop, but it represents a fall of 1/3 of a standard deviation in average performance.
The second-largest line item is described as “health and human services.” This catch-all category captures the bulk of state spending on public health and poverty relief. Here’s how the state’s poverty rate has fared since 2000:
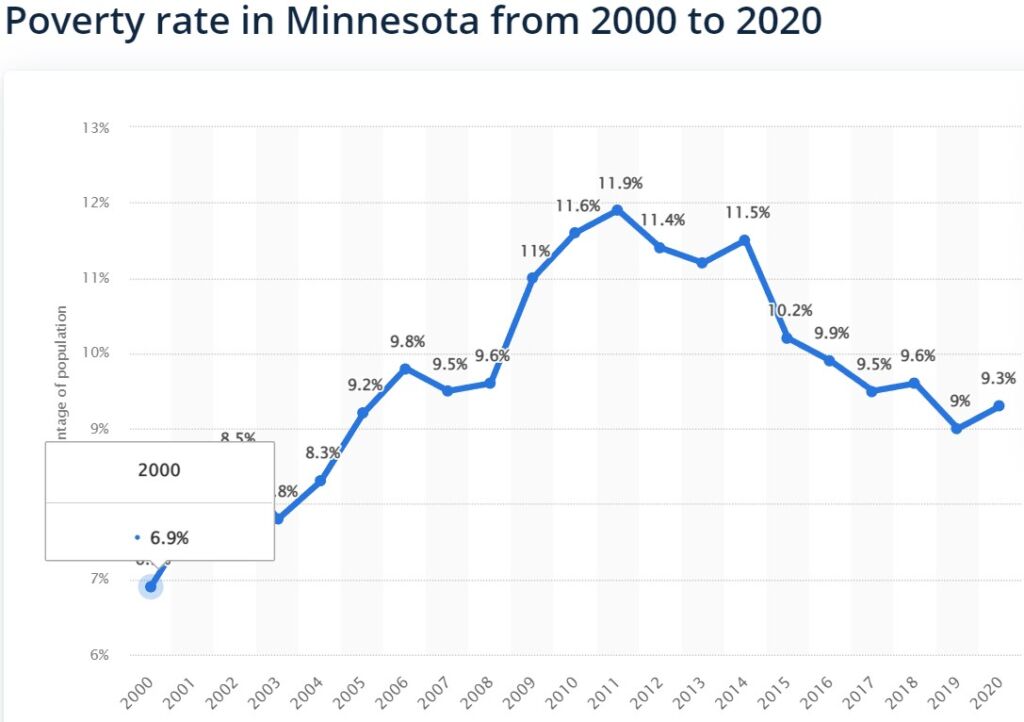
The rate ballooned up during the great recession between 10 and 15 years ago. But the current level is significantly higher than it was twenty years ago.
During that time, the state spent roughly $120 billion on this category. In round numbers there are 550,000 poor people in Minnesota. That works out to about $11,000, per year of state tax dollars, per person, without moving the needle on poverty.
Those figures do not include the massive amounts spent using federal and local resources.
Public health efforts have fared no better. During the late 1900’s, life expectancy in Minnesota was increasing by more than a year per decade. The current level in Minnesota is 79.1 years, one of the highest in the nation, but lower than it was in 2005.
It’s your money!