Doubling Down on Failure Installment Two: Generation, Utility Profits, Property Taxes, and Transmission
This article is the second installment explaining the findings of our new study entitled Doubling Down on Failure, How a 50 percent by 2030 Renewable Energy Standard Would Cost Minnesota $80.2 Billion.
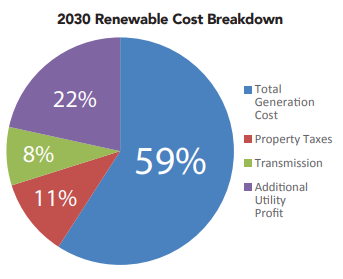
Today, I’ll break down four main components that drive the cost of our energy system that we explored in our study. As you can see below, generation accounted for 59 percent of the total cost of electricity in the Renewable Scenario, utility profits constituted 22 percent, property taxes accounted for 11 percent, and transmission accounted for 8 percent of the total cost of electricity.
Generation Costs
Generation costs are calculated using a methodology called the Levelized Cost of Energy (LCOE), a figure that represents the per megawatt hour (MWh) cost of building and operating a generating plant over an assumed financial lifetime and the quantity of electricity generated by the plant.
In the Renewable scenario, 45 percent of electricity generation comes from wind, and 9 percent comes from solar, which is one reason why this scenario had much higher generation costs than the Short-Term Nuclear, Long-Term Nuclear, or ACE scenarios. Generation costs in the Renewable scenario are also higher because wind and solar are intermittent, and as a result, they require natural gas backup generation to produce electricity when the wind is not blowing or the sun is not shining, and this increases the cost of generating electricity from wind and solar for consumers.
Although the need to account for these costs should be obvious, studies on the cost of renewable energy, like the study claiming renewables are cheaper than 74 percent of existing coal plants, almost never take them into consideration. The reason? They couldn’t pretend that subsidized wind and solar are cheaper than existing coal if they had to report the full cost of using them.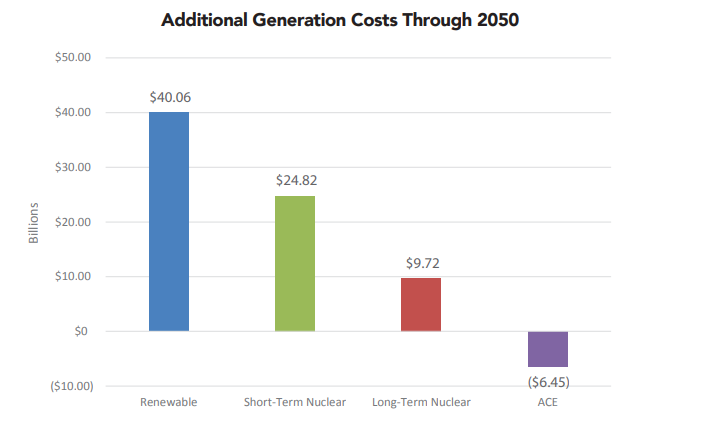
Generation costs for Short-Term Nuclear is cheaper than the Renewable scenario, but more expensive the Long-Term Nuclear or ACE scenario because the STN shuts down all existing coal plants before 2030, whereas LTN and ACE utilize these resources for decades longer. The ACE scenario, which simply uses Minnesota’s existing coal-fired power plants to generate electricity, is the only scenario that would save consumers money compared to today’s costs.
Utility Profits
Because investor-owned utilities (IOUs) such as Xcel Energy, Minnesota Power, and Otter Tail Power, are regulated monopolies in Minnesota, they are not allowed to make a profit on the electricity they sell. Instead, they are guaranteed a profit when they spend money on capital assets such as power plants, transmission lines, and even new corporate offices.
The amount of profit a utility makes on these capital assets is called the Rate of Return (RoR) on the Rate Base. For the purposes of our study, we assumed this profit would be 7.5 percent on undepreciated capital because this is the current rate of return for Xcel Energy and Otter Tail Power.
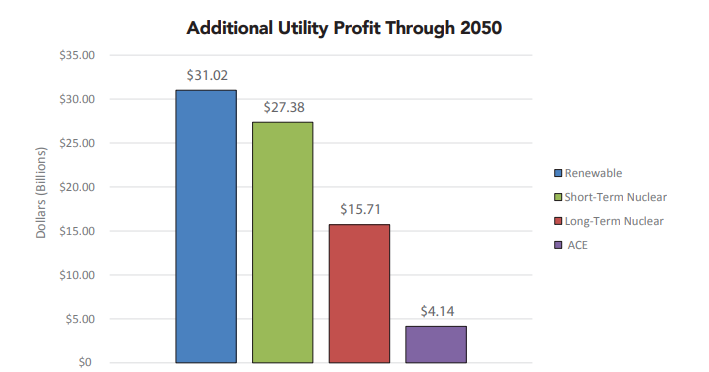
Additional utility profits are highest under the Renewable scenario, reaching $31 billion through 2050. Profits for IOUs are $27.38 billion through 2050 under the Short-Term Nuclear scenario and $15.71 billion under the LongTerm Nuclear scenario. Utility profits are smallest under the ACE scenario, only $4.14 billion through 2050, because utility companies are not prematurely retiring resources that Minnesota families and businesses have already paid for and replacing them with new capital assets.
Utility profits are highest in the Renewable scenario because Minnesota must pay to build new wind and solar facilities and overbuild the grid to ensure reliability, increasing the amount of capital invested and raising profits. This is why Xcel Energy has seen its profits increase by more than $25 million per year since 2007. That represents nearly a 40 percent increase between 2007—when Minnesota passed its first renewable energy mandate—and 2016.
Guaranteed corporate profits, not the environment, are why Xcel Energy has been supportive of Governor Walz’s 100 percent “carbon free” electricity mandate. If enacted, Gov. Walz’s proposal would be a government-mandated wealth transfer from Minnesota families to the monopoly utilities that helped write the legislation.
This is crony capitalism at its worst.
Property Taxes
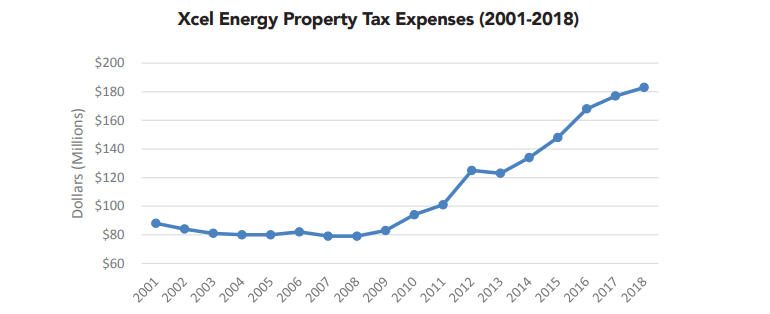
I am unaware of any other study that details how increasing renewable energy mandates result in higher property taxes. We got the idea after meeting with an industry person who said that one reason electricity prices are rising is because of increasing property taxes. We looked at Xcel Energy’s property taxes because their renewable mandate is highest under the Next Generation Energy Act, signed into law in 2007, and sure enough, property taxes have increased.
However, Xcel’s property tax expenses are not increasing because property tax rates have suddenly skyrocketed. Xcel’s property tax expenses are skyrocketing because they have more property to tax, i.e. wind turbines, natural gas plants, and transmission lines.
Therefore, we knew property tax expenses would increase if lawmakers Doubled Down on Minnesota’s renewable energy mandate. Total property tax expenses for the Renewable scenario were $8.27 billion, $4.19 billion for the Long-Term Nuclear scenario, $7.30 billion for the Short-Term Nuclear scenario, and $1.02 billion for the ACE scenario. Property tax payments for utilities were calculated to be 2 percent of the undepreciated cost of generation assets installed in each respective scenario, which is a midpoint of property tax expenditures for Xcel Energy, Minnesota Power, Otter Tail Power, and Great River Energy
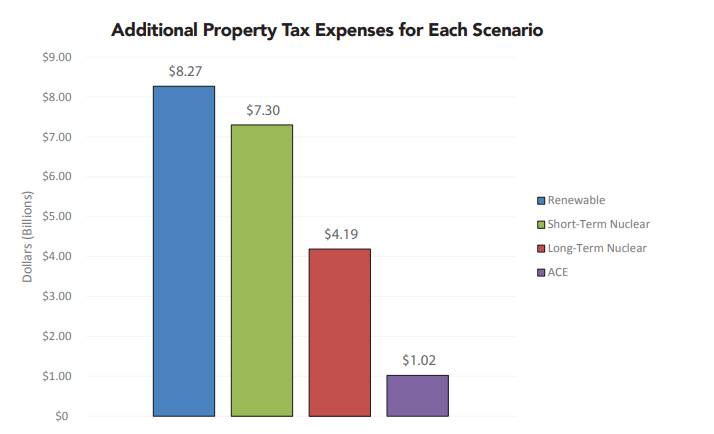
Property taxes were highest in the Renewable scenario because companies are paying taxes on the wind turbines, solar panels, natural gas plants, and transmission lines. Costs are lower in the nuclear scenarios due to lower capital costs and transmission costs, and the ACE scenario is again the lowest cost because it is using existing infrastructure.
Transmission
Transmission costs are important: Electricity generated does no good if it cannot be transported to the families and businesses who rely upon it. Our analysis found the Renewable scenario would cause transmission costs to increase by slightly more than $3 billion compared to 2016 costs. Both nuclear scenarios would cause transmission costs to increase by $100.4 million, whereas the ACE scenario would have minimal additional transmission costs because these power plants and transmission systems have already been built.
![]()
Transmission costs are higher under the Renewable scenario because wind turbines, and to a lesser extent solar installations, are frequently built far away from the areas where the electricity will be used by customers. High-voltage transmission lines routinely cost $1 million per mile.
Xcel Energy, Minnesota Power, Otter Tail Power, and Great River Energy are planning to build or purchase at least 1,846 megawatts (MW) of wind power from North and South Dakota.28 This is a large amount of wind capacity, the equivalent of half of all the wind turbines installed in Minnesota. Hundreds of miles of transmission lines must be built, and maintained, to transport this electricity to population centers in the Twin Cities Metro area.