Employment data shows Minnesota’s metropolitan areas slipping relative to its neighbors
Yesterday saw the release by the Bureau of Labor Statistics of its estimates of Metropolitan Area Employment and Unemployment.
These can be a useful way to compare economic performance. Minnesota’s economy differs from those of neighbors such as Iowa and North Dakota, even Wisconsin. This restricts the usefulness of comparisons of state level data. This variation is a little less pronounced between urban areas.
Minnesota and its neighbors
So what did the BLS data show?
Table 1 shows the 29 metropolitan areas in Minnesota and the neighboring four states ranked by the percentage point declines in their unemployment rates from March 2017 to March 2018. On this measure, Iowa (orange areas) is the star performer. All 7 of its MSAs are among the 13 best performers. Wisconsin does next best, with 5 MSAs in that top 13. Minnesota’s star performer, Duluth, rounds it out. The data doesn’t look good for the Dakotas who prop up the table, but Minnesota also has 4 of its 5 MSAs among the bottom 12.
Figure 1
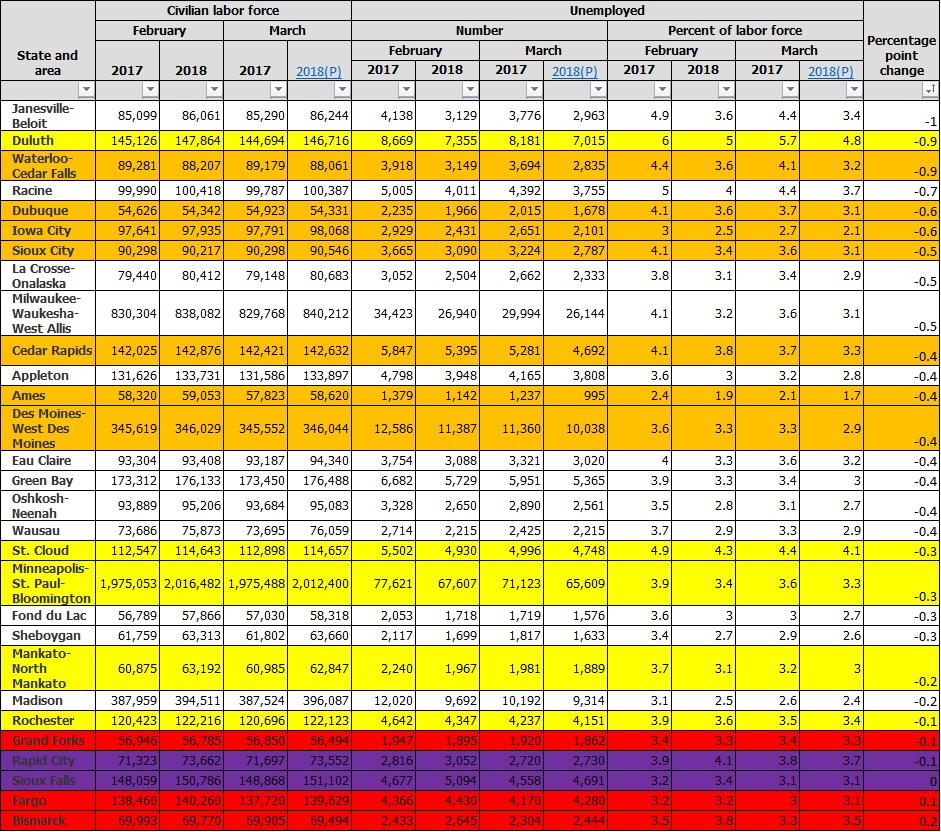
Source: Bureau of Labor Statistics
Isn’t this because unemployment was higher in these areas of Iowa and Wisconsin to start with so had further to fall?
There is some truth to this. Figure 2 shows the 29 metropolitan areas in Minnesota and the neighboring four states ranked by their unemployment rates in March 2017. Minnesota’s star performer, Duluth, Janesville-Beloit and Racine (the 2 Wisconsin MSAs with the biggest fall), and 4 Iowa MSAs can be found among the 9 MSAs with the highest unemployment rates in March 2017. But Minnesotan MSAs such as St. Cloud, Minneapolis-St. Paul-Bloomington, and Rochester, have not seen their rates fall as much as we might have expected given their rates of unemployment in March 2017.
Figure 2
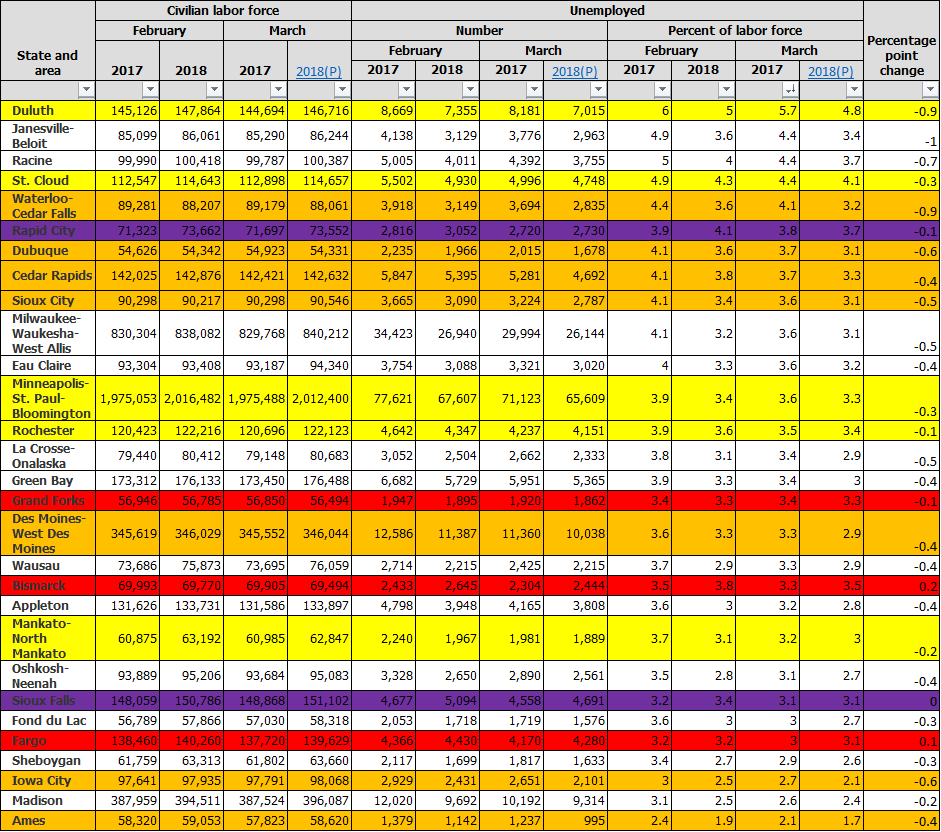
Source: Bureau of Labor Statistics
Figure 3 shows the 29 metropolitan areas ranked by their unemployment rates of March 2018. The picture is rather different. Whereas Minnesota had just 2 MSAs among the 11 with the highest unemployment rates in March 2017, by March 2018 that was up to 4. Indeed, Minnesota’s start performer here, Mankato, has the 11th lowest unemployment rate out of the 29 MSAs.
Figure 3
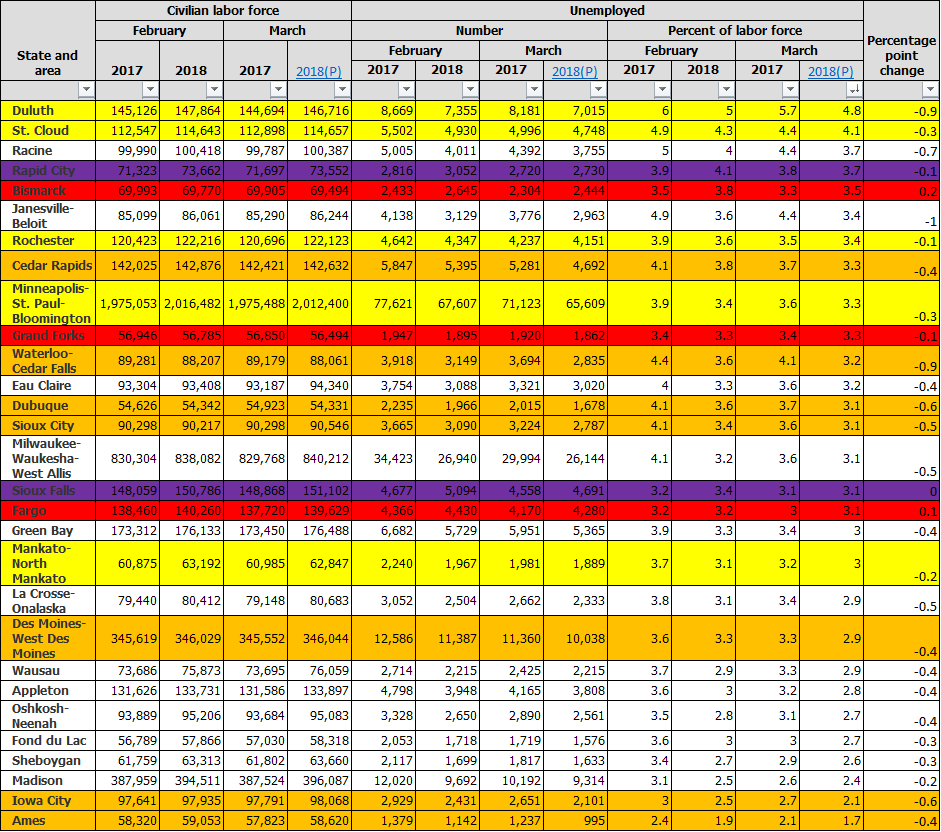
Source: Bureau of Labor Statistics
With the previously mentioned caveats about state level data, let’s finish with a quick look at our state and its four neighbors. Figure 4 shows Minnesota and its neighbors ranked by their unemployment rates in March 2018. We see that in March 2017 Minnesota had the highest unemployment rate of the 5 states. In March 2018, our state still had the highest unemployment rate of the 5. We have previously commented on the the jobs boom across the St Croix, but Iowa’s impressive performance should also be noted.
Figure 4
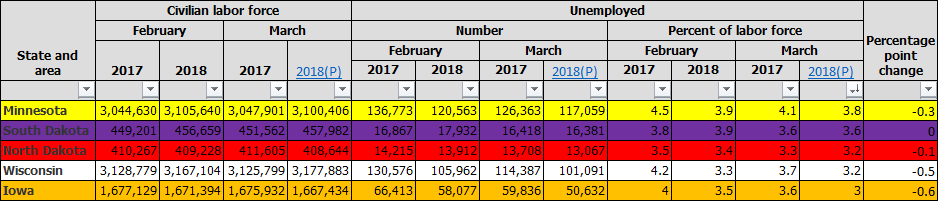
Source: Bureau of Labor Statistics
Minnesotans cannot take their economy for granted
This is just one release from one data set. It would be ridiculous to infer impending economic doom from these numbers. But prosperity cannot be assumed, it must be nurtured. To do this, we have to keep a close eye on all the indicators of economic health.
John Phelan is an economist at Center of the American Experiment.