Federal data shows Twin Cities light rail is the most dangerous in America
According to federal data, people who decide to step on light rail in the Twin Cities are at more risk for being injured by an assailant than any other light rail system in America. This dramatically higher rate of crime and injury on Metro Transit light rail reveals years of mismanagement. This mismanagement only adds to Metro Transit’s embarrassing delays and cost overruns with the Southwest Light Rail Transit project. With this record of failure, Minnesota lawmakers need to seriously reexamine the future of the Met Council that runs Metro Transit and the ongoing expansion of light rail.
Background
Federal law requires the Federal Transit Administration to maintain a National Transit Database to support planning efforts, make multi-year comparisons and perform trend analyses. Part of this data collection tracks personal security events, which includes assault, homicide, robbery, larceny/theft, motor vehicle theft, rape, and suicide. Because the FTA maintains a uniform method of collecting and reviewing the data, it represents the best source for comparing light rail systems.
Personal security events must meet a certain reporting threshold of injury to be counted. This includes a fatality, a serious injury, or an injury requiring transport from the scene for medical attention. Serious injuries are those that require hospitalization; result in fractures; cause severe hemorrhages or nerve, muscle, or tendon damage; involve an internal organ; or involve second- or third-degree burns. These thresholds effectively limit the data to only major events where victims were injured during a crime. Thus, the number is much smaller than the total amount of crime reported by law enforcement agencies.
Importantly, this focus creates a more apples to apples comparison to determine where crime leads to the most severe injuries—the sort of crime people fear most and want to avoid. The data presented here excludes suicides to further narrow the focus on injuries people suffer when they are victimized by another person committing a crime.
The Data
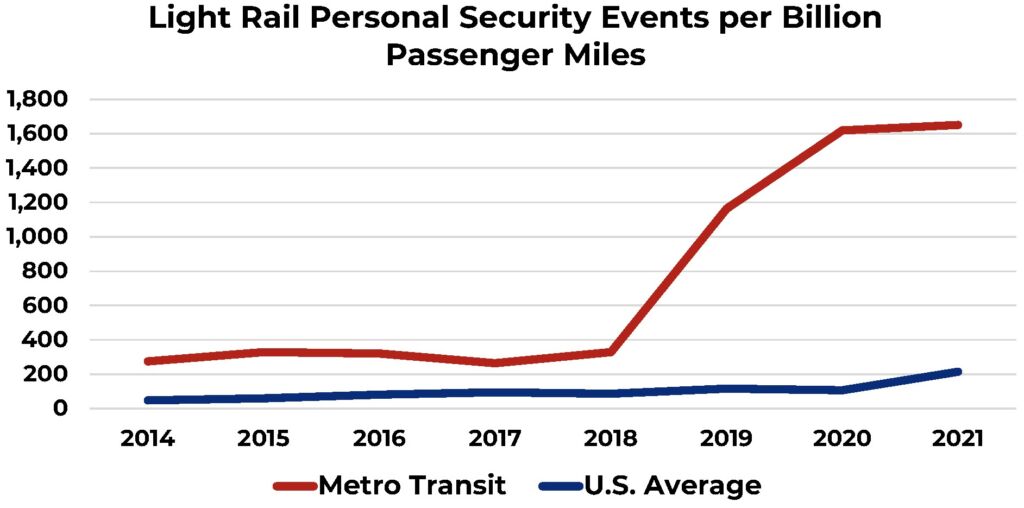
Overall, this data shows Metro Transit has consistently operated one of the most dangerous light rail systems in the country since 2014. The following figure shows the rate of people injured by an assailant on Metro Transit light rail was substantially higher than the national average from 2014 to 2018. However, this rate soared dramatically higher than any other light rail system in the country in 2019. That year, the rate of people injured per billion passenger miles leapt to 1,164. That represents a 254 percent increase from the previous year. This rocketed the rate to 6.7 times higher than the national average.
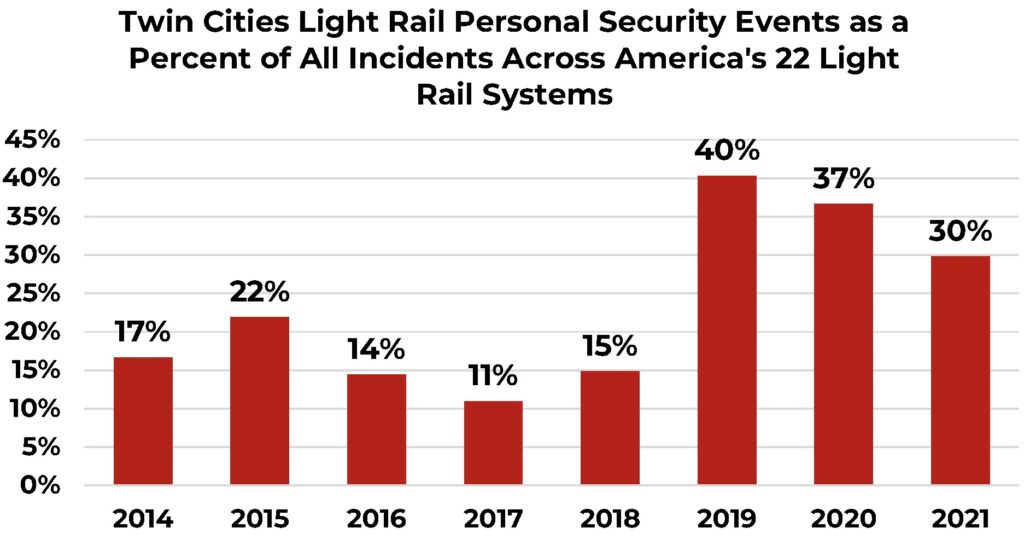
Looking at the number and proportion of personal security events occurring on Metro Transit light rail is maybe more shocking. The number of personal security events jumped from 33 in 2018 to 117 in 2019. That’s twice as many as the next closest light rail system. As the next figure shows, that’s also 40 percent of all personal security events that occurred across America’s 22 light rail systems. Putting that in context, Metro Transit accounted for 40 percent of personal security events on light rail while carrying only 4 percent of passenger miles.
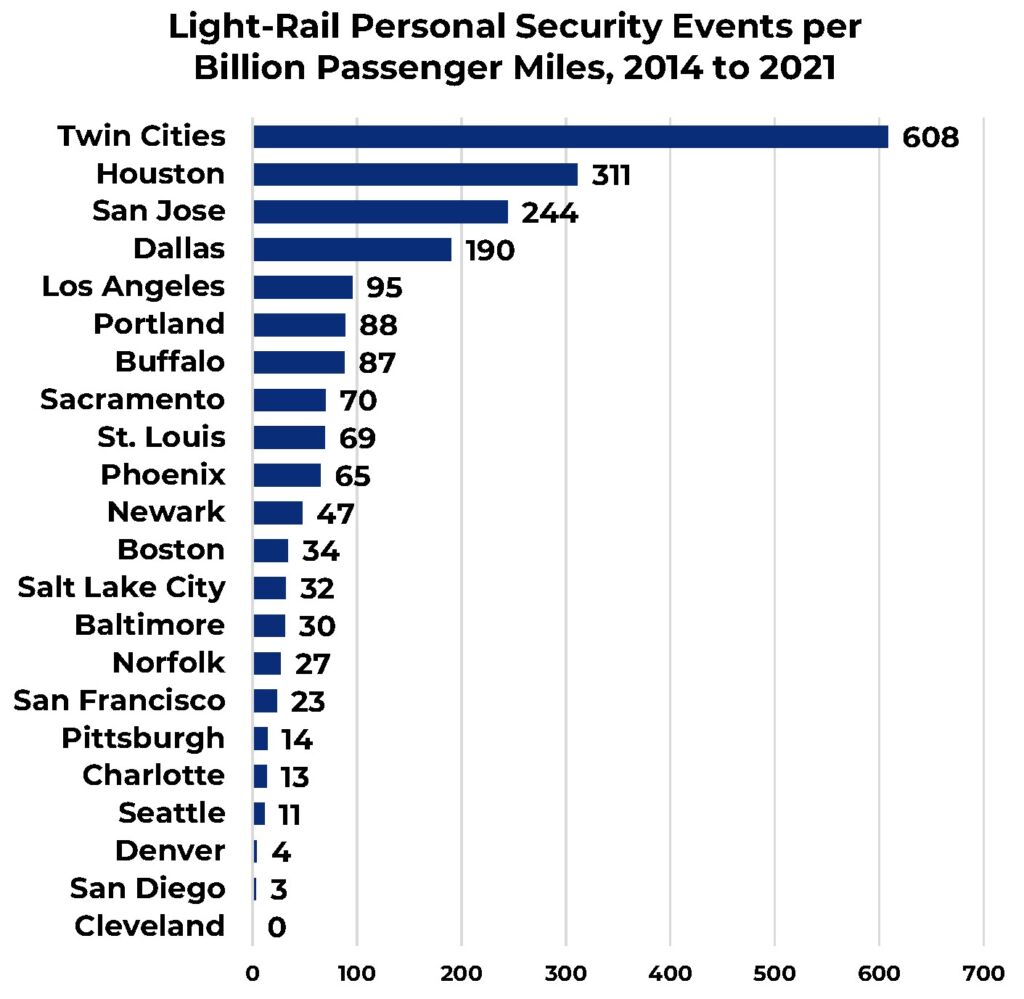
The next figure aggregates all the personal security events from 2014 to 2021 and compares the rate of personal security events over this time period in the Twin Cities to every other light rail system. The Twin Cities is by far the highest—nearly twice the rate of Houston, the next closest city.
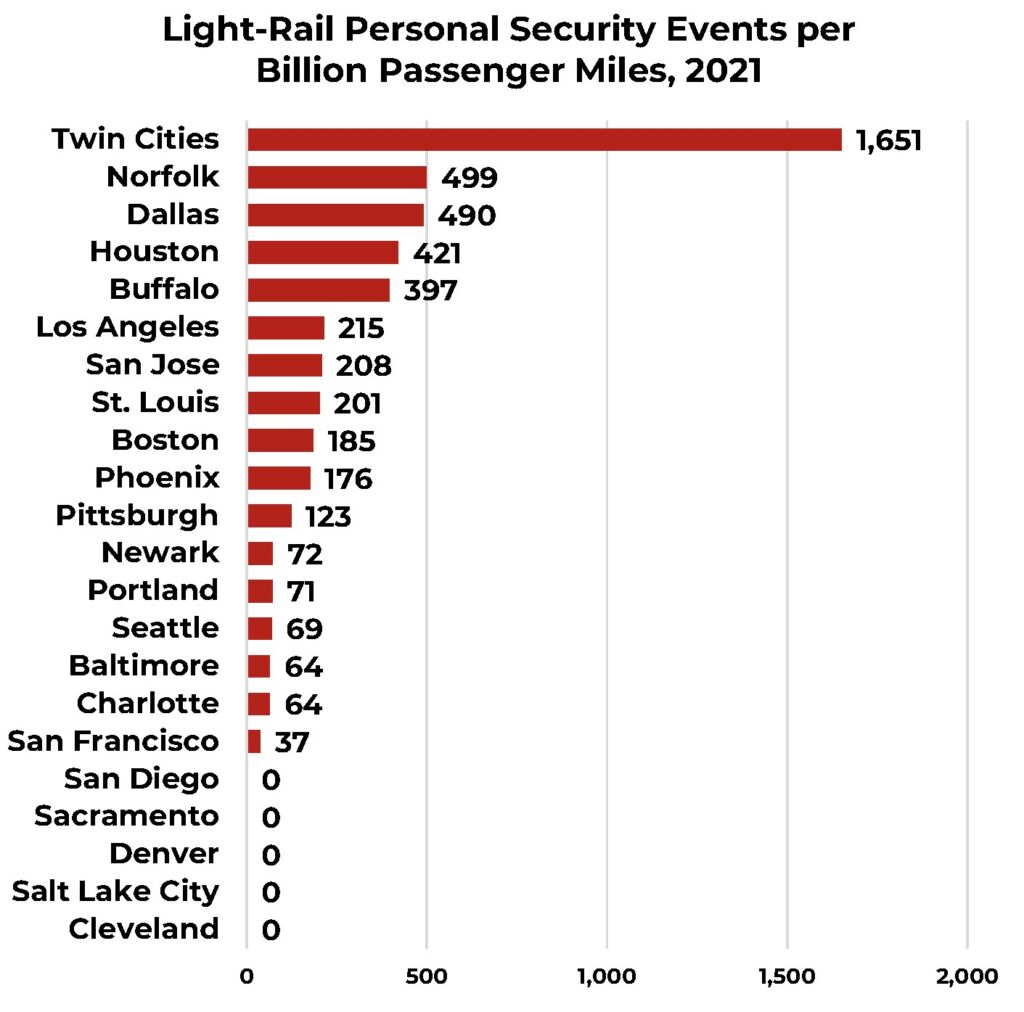
In 2021, when ridership was down across the country due to the pandemic, the Twin Cities also claimed the highest rate of personal security events. As the following figure shows, the rate was 3.3 times higher than Norfolk, the city with the second highest rate. Five cities had zero personal security events. San Diego managed to achieve this feat despite carrying the second most passenger miles in the country.
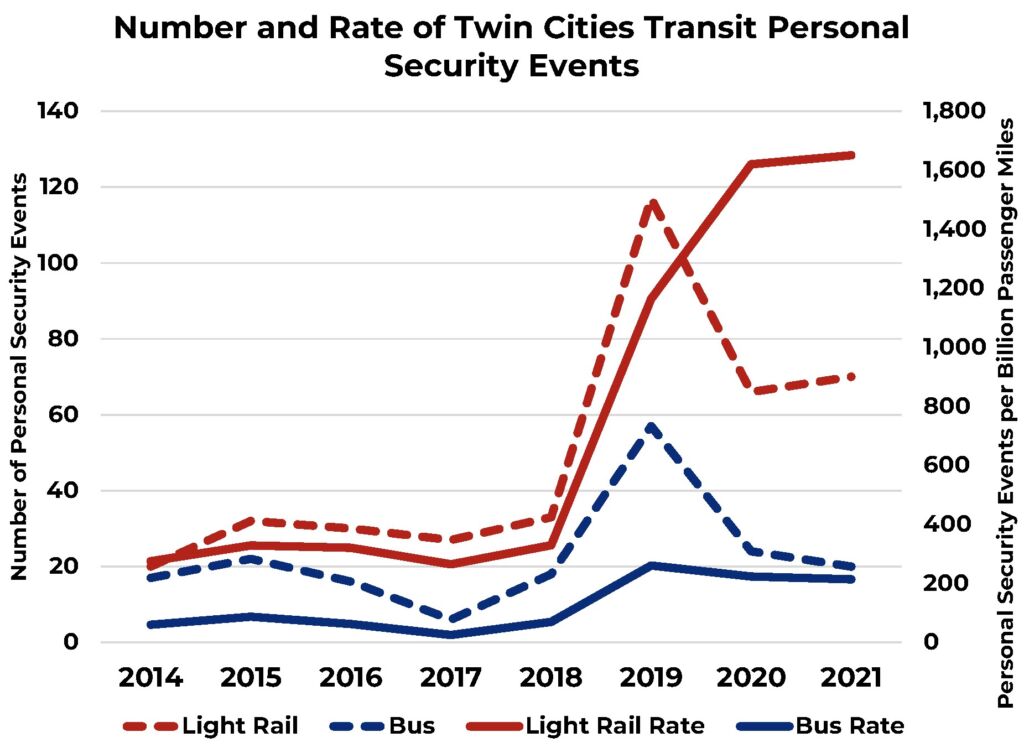
This final figure compares both the number and rate of personal security events between light rail and bus transit in the Twin Cities. In each year, both the number and rate of person security events on light rail exceeds buses. However, light rail experiences a much steeper increase in the number and rate in 2019.
The analysis here reflects crime on light rail systems in America and, therefore, excludes crime on heavy rail transit like New York subways. Metro Transit should strive to meet the standards of light rail systems which are more similarly situated. That said, the results would be no different if heavy rail were added. When accounting for the much larger number of riders who use heavy rail, the rate of personal security events on Metro Transit light rail far exceeds any heavy rail system. In 2019, only New York City Transit (453) and the Chicago Transit Authority (135) reported a higher number of personal security events on rail compared to Metro Transit (117).
Management Failure
The dangerous conditions that Metro Transit allows to fester in their light rail system has certainly not gone unnoticed. Several news reports account for not just the increase in crime, but the increase in nuisance behavior that makes the current light rail network uncomfortable to ride, to say the least. A recent story in the Star Tribune documents the experiences of riders who witness drug use, smoking, partying, mental illness, homelessness, vandalism, and even sex.
The news story framed this as a problem of “perception” which creates a “narrative” that “works against Metro Transit’s efforts to bring back passengers lost during the COVID-19 pandemic.”
However, the federal data shows this is a problem with reality, not perception. It shows the reality light rail riders face in the Twin Cities is far different and far more dangerous than other cities. This is not a marketing problem. This is a management problem.
The Star Tribune story admits the current perceptions of light rail raises questions about whether transit is being effectively managed. But there is no question. The data presented here provide a clear answer: the Met Council has failed to provide a safe and comfortable experience for light rail riders.
Though the data show a dramatic spike in personal security events on Metro Transit light rail in 2019, this was not when the problem started. Beginning in 2014, the data show that Metro Transit light rail experienced the highest rate of personal security events in every year except 2016 and 2017. This shows the failure started under the leadership of Governor Dayton and only grew worse when Governor Walz took over.
The reality of failed management and severe safety issues does raises some obvious questions. Should we continue expanding the region’s light rail network? Will enough riders use the delayed and over budget Southwest Light Rail Transit line to justify finishing the project? Should the Met Council continue to govern in its current form? These are all important questions for the next legislature and governor to answer.