How does Minnesota’s economy really compare to its neighbors?
At the press conference to launch the February Budget and Economic Forecast recently, Minnesota’s state economist, Laura Kalambokidis, said that our state’s economy was “outperforming its neighbors”. Is this true?
North Dakota beats us on GDP growth
Well, the main measure of an economy is Gross Domestic Product, the total value of goods and services produced in an economy in a given year. Figure 1 shows how Minnesota and its neighbors fared on this measure between 2010 and 2018, the last year for which there is data. The United States is also included. Except for North Dakota’s stellar growth (40.3%), all of these states have under-performed the U.S. rate (19.5%) over this period – Minnesota ranked second (17.2%), then South Dakota (15.9%), Iowa (15.1%), then Wisconsin (13.9%). Incidentally, from 2017 to 2018, Minnesota’s real GDP growth rate was below that of North Dakota and the U.S. generally.
Figure 1: Real GDP growth, 2010 to 2018, 2010=100
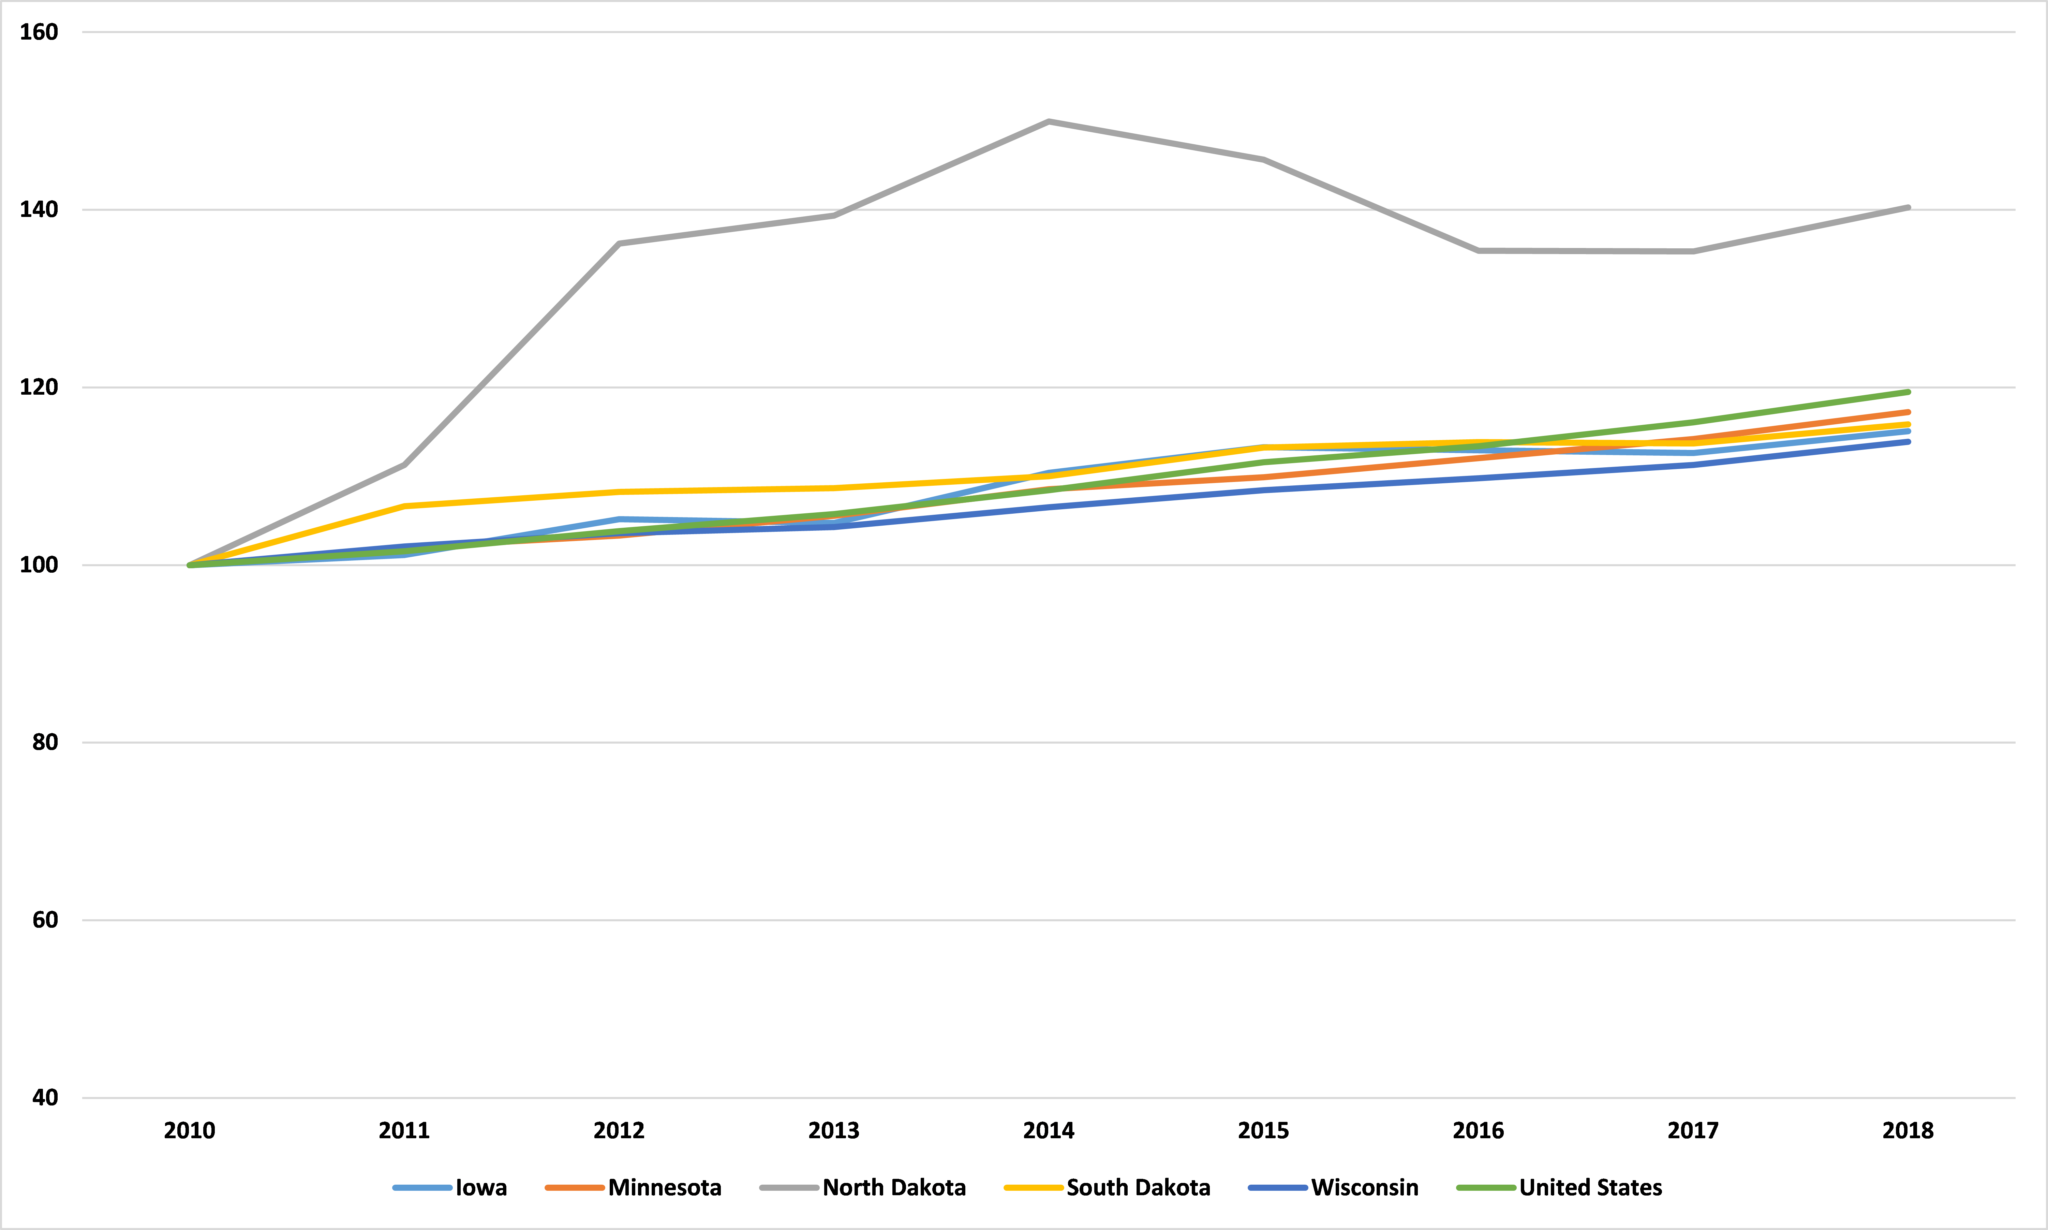
Source: Bureau of Economic Analysis
Both Dakotas beat Minnesota on population growth
But, as I’ve written before, a growing economy might not lead to rising incomes per head if it simply a result of increasing population. Figure 2 shows that, between 2010 and 2018, Minnesota’s population has grown at very nearly the national rate (5.7% to 5.8%). This is below the rate of North (12.7%) and South Dakota (8.1%), but above the rate of Iowa (3.5%) and Wisconsin (2.2%).
Figure 2: Population growth, 2010 to 2018, 2010=100
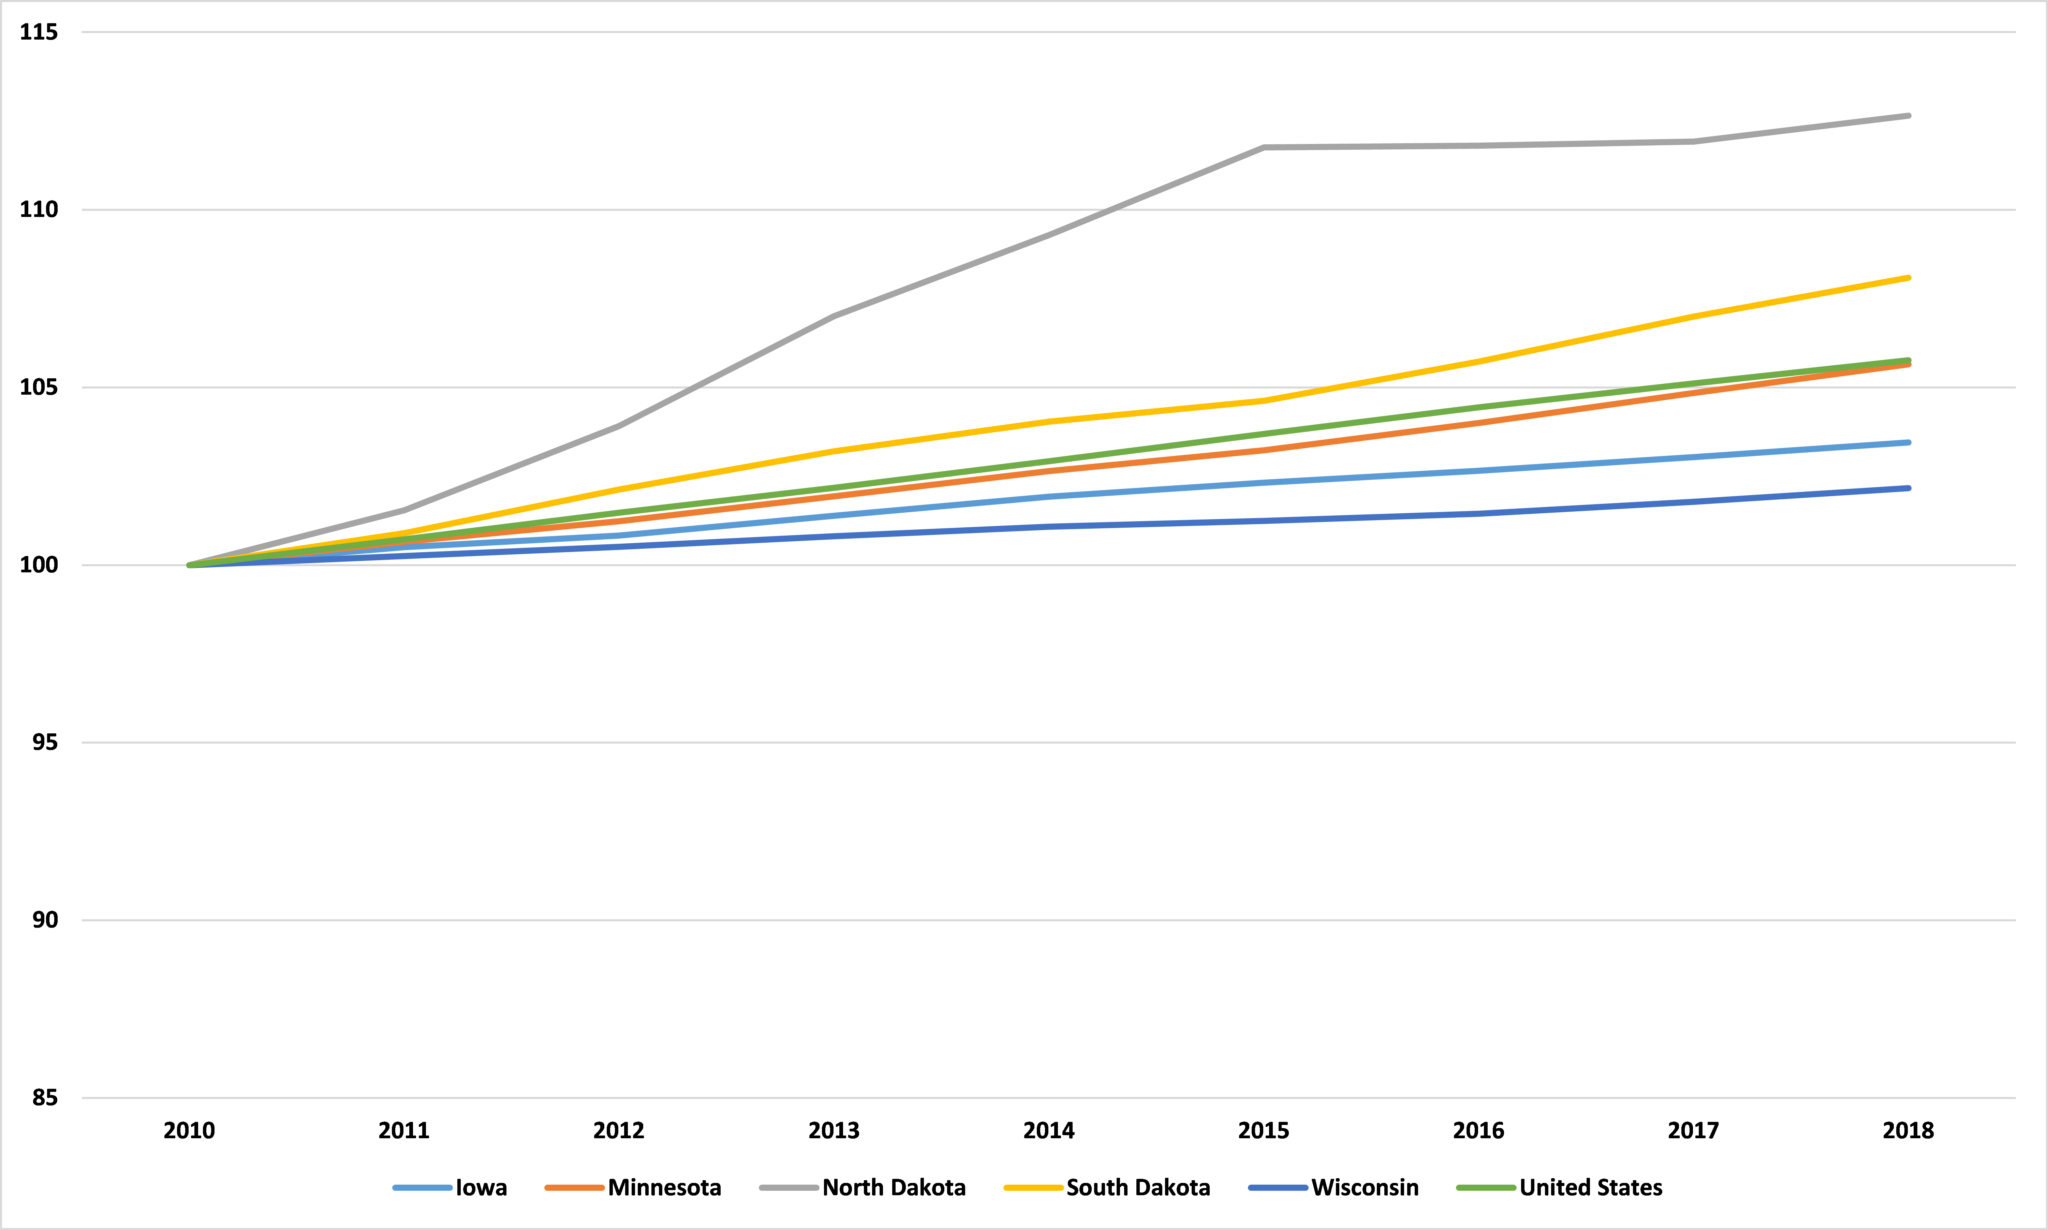
Source: Bureau of Economic Analysis
Every neighboring state except South Dakota beats Minnesota in per capita GDP growth
So, taken together, what do these GDP numbers and population numbers mean for per capita GDP, an important measure of economic welfare?
As Figure 3 shows, on this measure Minnesota (10.9%) lags North Dakota (24.5%), Wisconsin (11.5%), and Iowa (11.2%). It also lags the national level (13.0%). The only one of our neighbors we beat on this measure is South Dakota (7.2%).
Figure 3: Real per capita GDP growth, 2010 to 2018, 2010=100
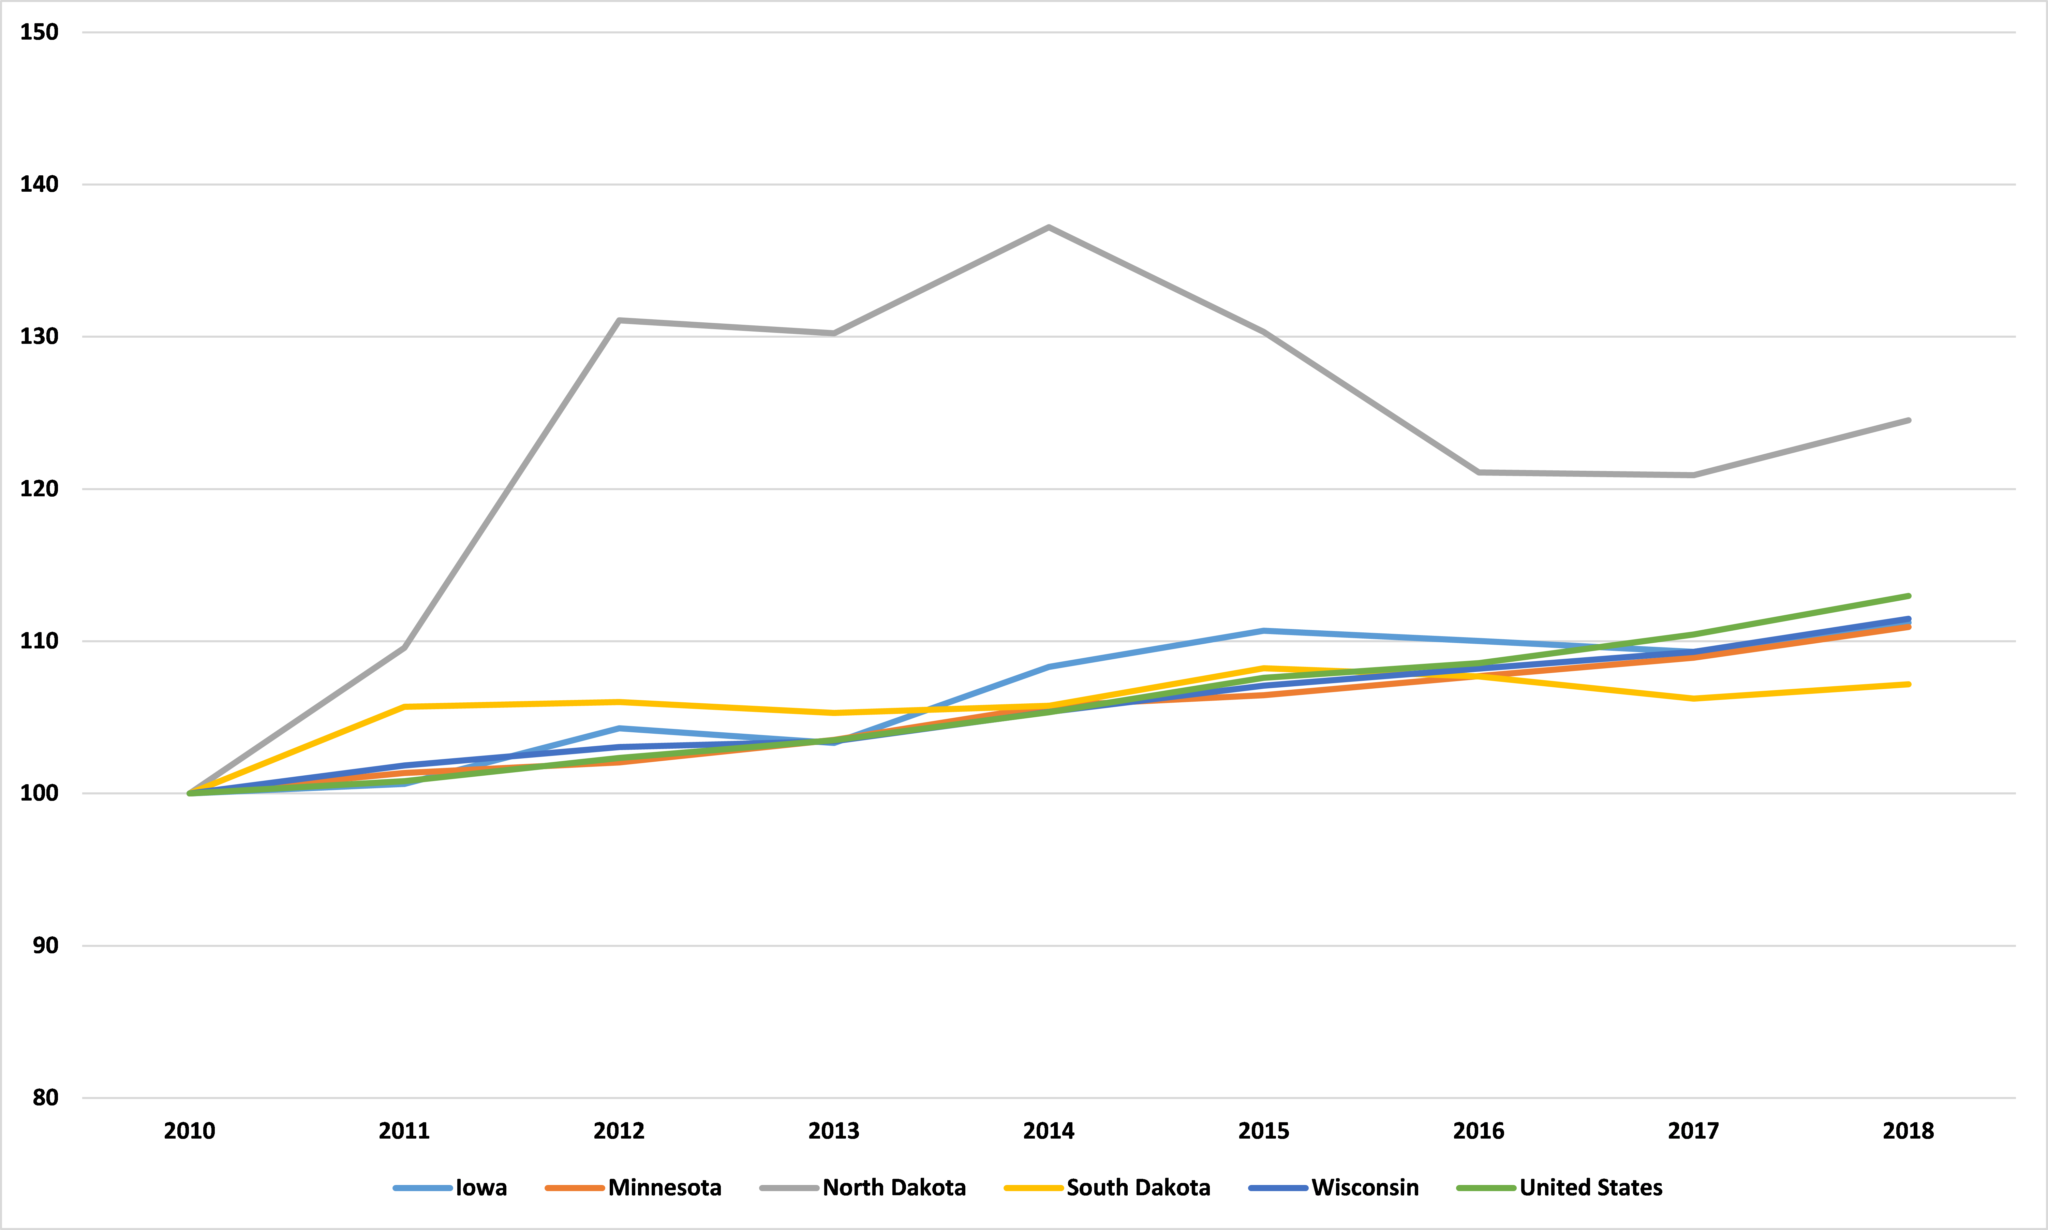
Source: Bureau of Economic Analysis
Minnesota lags North Dakota on job growth
Lastly, how have the state’s fared when it comes to job growth?
Figure 4 shows the change in total employment between 2010 and 2018. Once again, North Dakota leads with job growth of 15.5% over the period. Minnesota does well, coming in second with growth of 11.4%. We are ahead of South Dakota (9.6%), Wisconsin (9.0%), and Iowa (7.1%), though all five states lag the national level (16.1%).
Figure 4: Total employment growth, 2010 to 2018, 2010=100
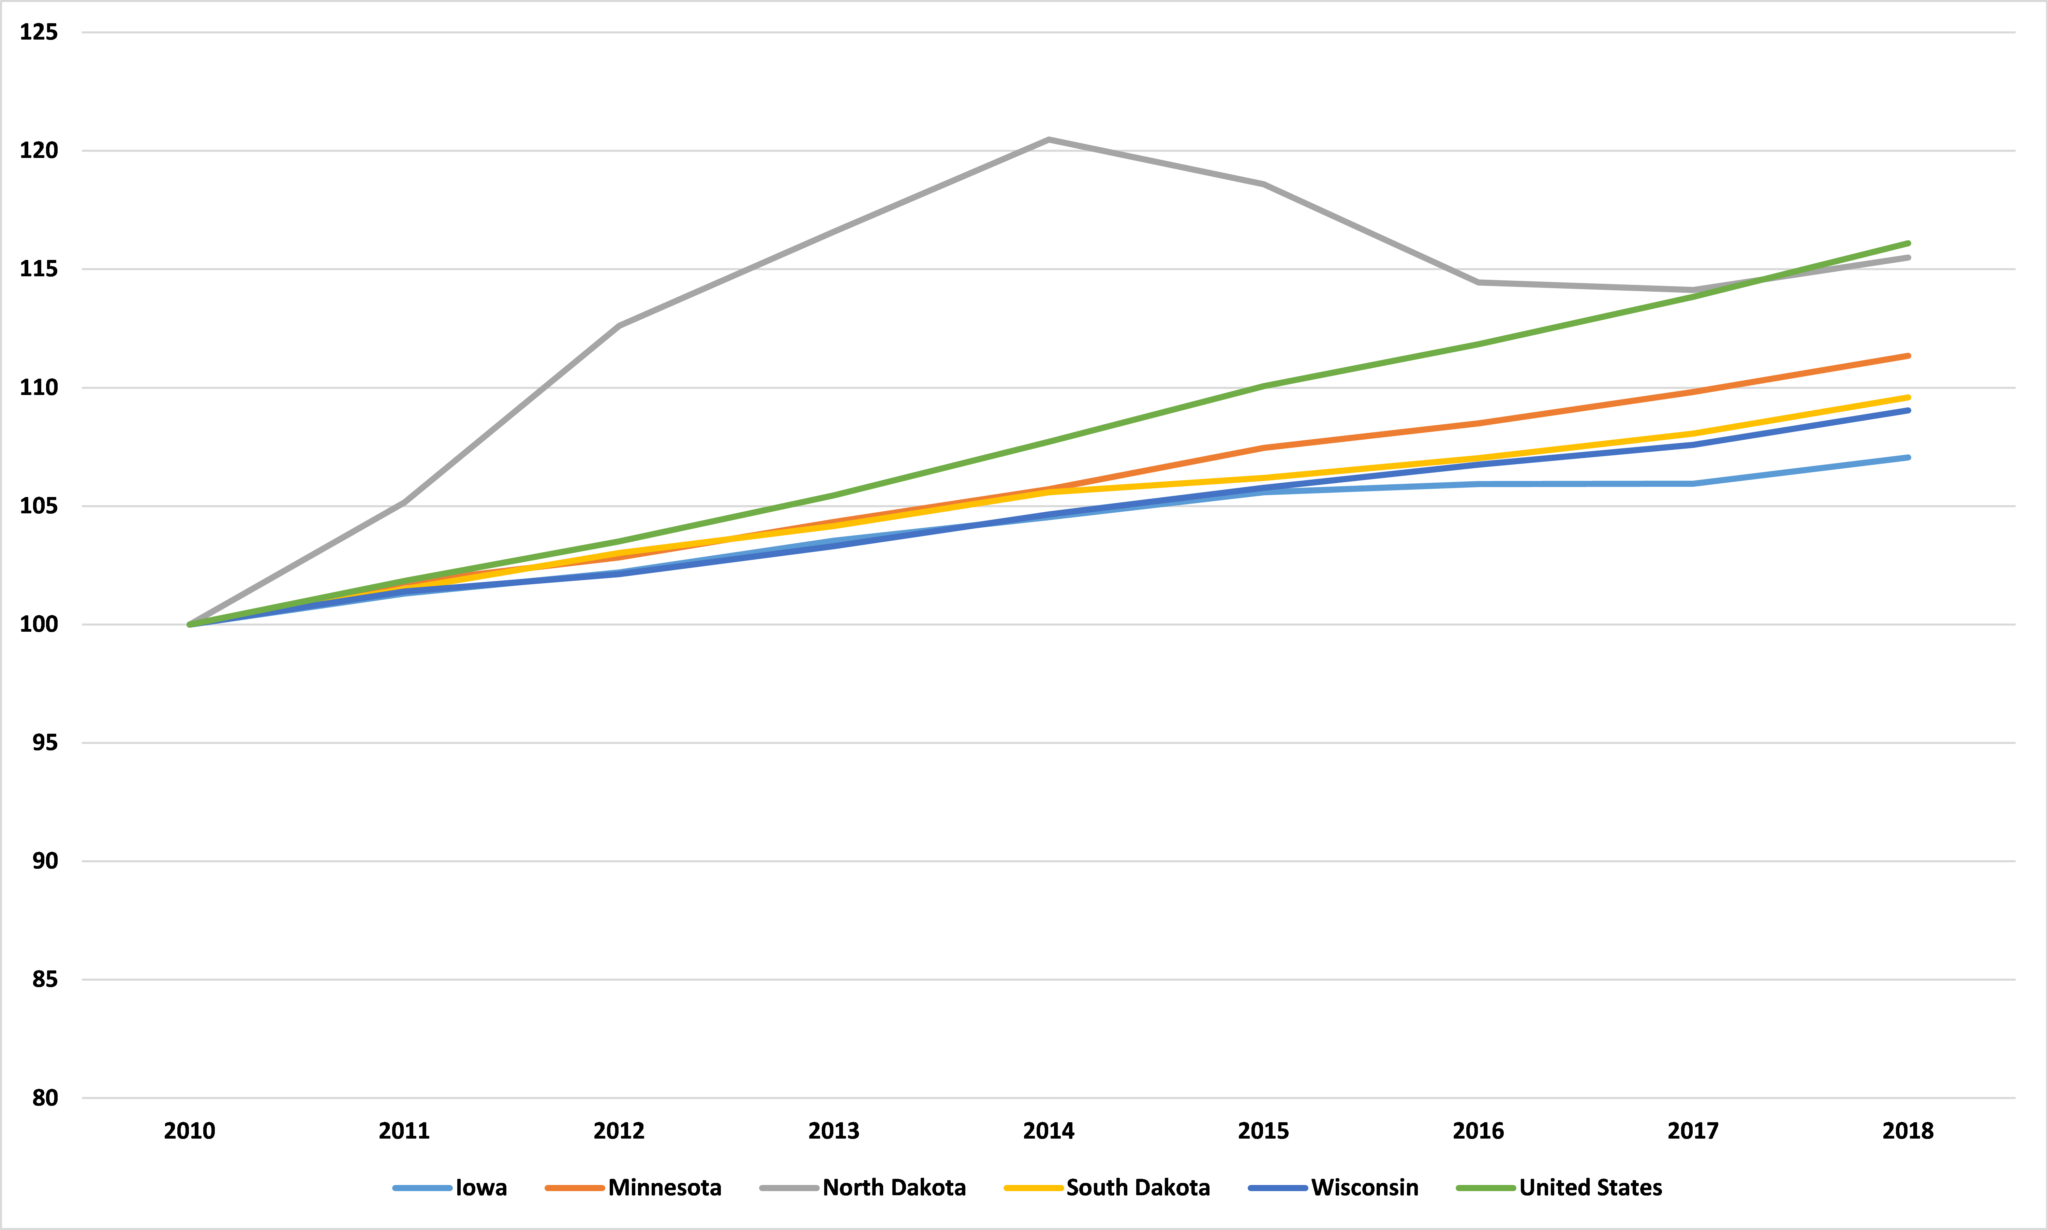
Source: Bureau of Economic Analysis
The final score
All told, out of Minnesota and its four neighboring states, North Dakota has been the star performer over the last decade, coming top in each category. Minnesota comes second* followed by South Dakota, with Iowa and Wisconsin joint last. Not a bad performance, to be sure, but it isn’t quite true that we are “outperforming [our] neighbors”. And we should not forget that our competition isn’t just the states next door, but every state in the union.
*Allocating 1 point for a first place finish, 2 for a second place finish etc
John Phelan is an economist at the Center of the American Experiment.