How Falling Production From Wind Turbines Increases the Cost of Wind Energy
Yesterday, we wrote about a newly-released, peer-reviewed study conducted by the Lawrence Berkeley National Laboratory that found a steep drop off in wind turbine production over the course of a wind turbine’s lifetime. The fact that wind turbines produce less electricity as they age has means that most of the cost estimates for electricity generated from wind turbines that don’t take this production decline into account are too low.
Less Productive Means More Expensive
The cost of generating electricity from all power plants is often expressed using a metric called the Levelized Cost of Energy (LCOE), which attempts to figure out the cost of each energy source per unit of electricity generated. In simpler terms, it is like attempting to figure out the cost of driving different cars for each mile driven, taking things into account like up-front cost, gas mileage, and the cost of fuel. The more miles you drive, the lower the cost per mile.
Similarly, the more units of electricity a wind turbine produces, megawatt hours (MWhs) are the most common unit discussed, the lower the cost of each individual megawatt hour. The problem is, most of the cost estimates for wind turbines assume that electricity production from wind turbines will not fall as the turbines age, which means these estimates are incorrectly assuming the cost will be lower on paper than we will experience in the real world.
How the Math Works
Lower electricity generation increases the cost of each megawatt hour of wind energy because the up-front costs of building the wind turbine are spread out over fewer units of electricity produced. The productivity of power plants is often talked about using the term “capacity factor” which is the percentage of electricity a power plant produces over the course of a year, compared to it’s full potential.
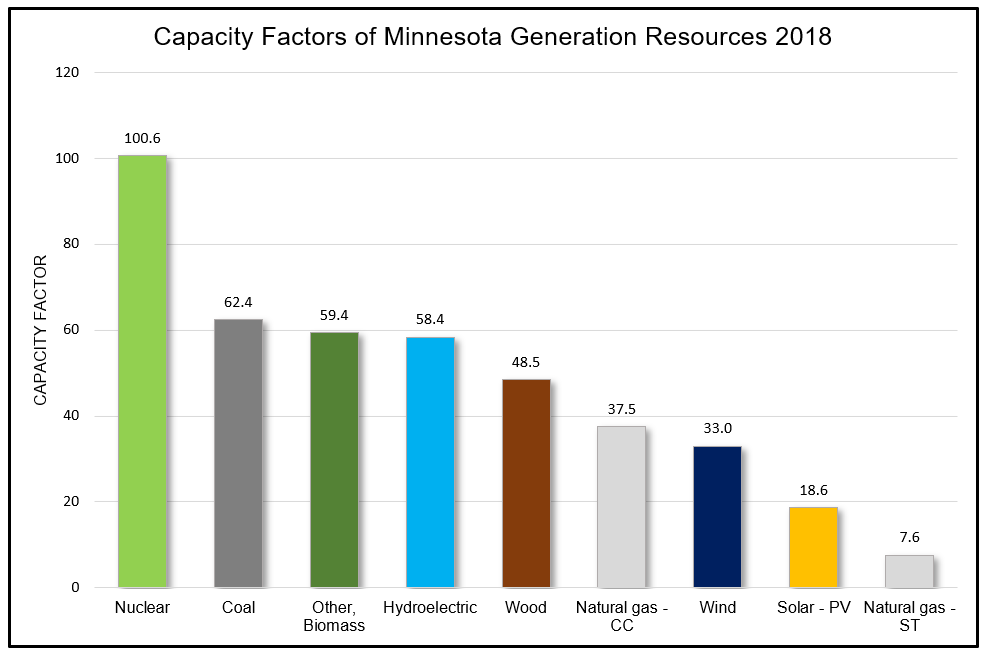
The graph below shows the capacity factor of different types of power plants in Minnesota for the year 2018 using data from the U.S. Energy Information Administrator (EIA). As you can see, the capacity factors for nuclear are very good, exceeding 100 percent of its net dependability rating. Coal also fares much better than wind, generating 63.4 percent of its potential, compared to just 33 percent for wind, and 18 percent for solar.
Even the most efficient wind turbine operation in Minnesota produced electricity just 45.6 percent of the time, according to data compiled by LBNL.
The low starting productivity of wind turbines makes the falling declines in productivity observed in the LBNL study even more problematic for their profitability.
How it Looks in the Real World
According to the Berkeley study, the older models of wind turbines (pre-2008) saw their capacity factors decline by 0.17 capacity factor points per year for years one through ten, with a large, one-time performance drop of 1.5 capacity factor points after year ten, and then a decline of 0.4 capacity factor points per year thereafter.

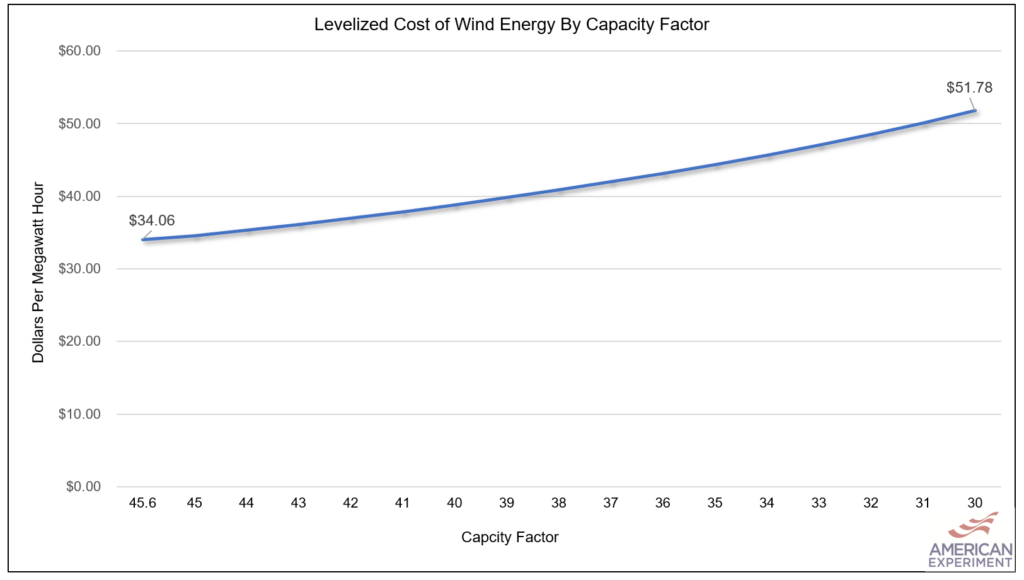
The graph below shows the LCOE of wind projects at different capacity factors. As you can see, the cost of generating electricity from wind increases as the capacity factor falls. For this analysis, wind turbine cost estimates from the Assumptions to the Annual Energy Outlook 2020 Electricity Market Module were used because they are the most recent assumptions available.
Using the decline rate for old wind turbines in the LBNL study, the cost increase for an aging wind turbine looks like this:
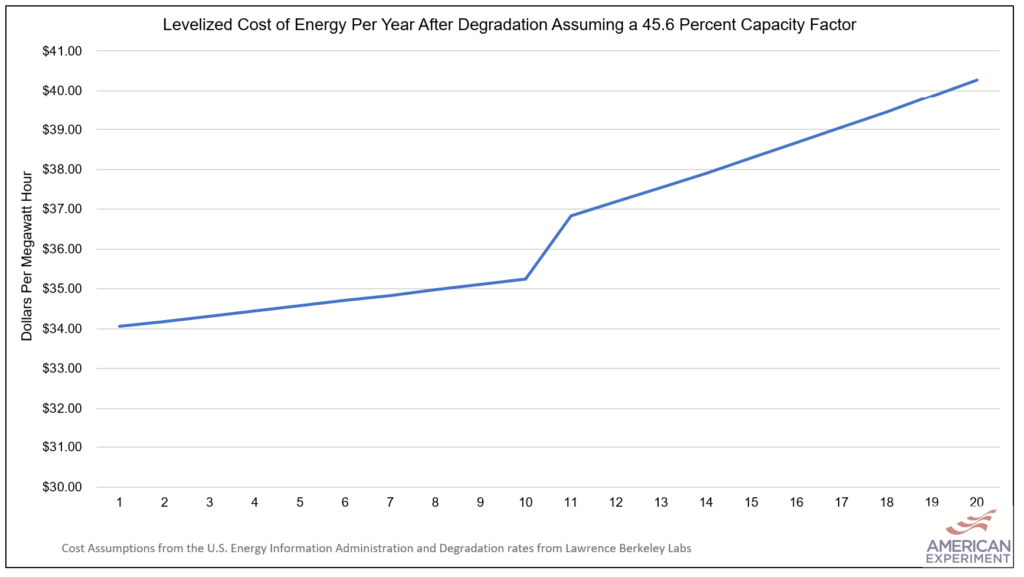
As the production profile of a wind turbine declines, the cost increases. For older wind turbines, the cost increase is low for the first ten years, and increases substantially for the final ten years of a wind turbine’s lifespan. In this example, the first-year cost of the wind turbine is $34.06 per megawatt hour, but by year 20, the turbine costs $40.27 per MWh, an increase of nearly 18 percent.
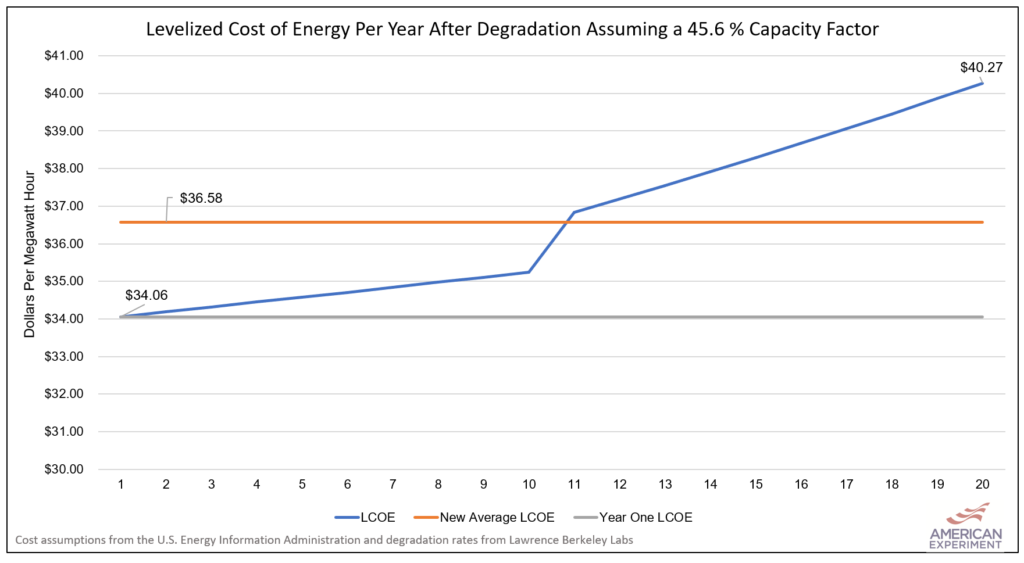
The problem with most cost estimates for wind turbines is that they assume that the Year One LCOE will hold steady throughout the entirety of a wind turbine’s useful life. The LBNL study states:
“Lifetime generation estimates depend on many parameters, including the rate at which plant performance declines with age. This rate is uncertain and varies by region. Often, this rate is not accounted for by investors, energy modelers, and policy makers.”
If we average out the cost increase observed over 20 years, the New Average LCOE is $36.58 per MWh, which is about 7.4 percent higher than the Year One LCOE.
It is important to note that rates of decline for newer wind turbines are lower, according to the LBNL study, with a rate of decline 0.06 capacity factor points per year, which is about a third of the rate of older turbines. As a result, the graph above is not an apples-to-apples representation of what newer turbines will do, but the LBNL study did not elaborate on what happens to the newer models after the production tax credit expires, likely because many of these newer models still qualify for the subsidy.
Conclusion
Lawrence Berkeley National Labs concluded that wind turbines experience significant production declines as they age, and that this trend becomes more prominent after wind projects are no longer eligible for federal subsidies. As the rate of production falls from wind projects, the cost of wind energy increases.
It is crucial for these degradation rates to be taken into account by energy modelers and policymakers if they want to accurately assess the cost of adding more wind turbines to the electric grid. Getting more information on the rates of production declines for newer models will also help inform these discussions.