How Minnesota compares on Medicaid spending
When it comes to welfare, Minnesota is a generous state as CAE’s newest report has outlined. This generosity is prevalent both when looking at spending as a share of the budget and per person in poverty.
But as the report also explained,
Outside of poverty status, welfare programs can target people based on other characteristics such as disability and age. So, total benefits vary among
recipients based on which programs they use. Moreover, most of the money that states spend on welfare programs goes to just one program: Medicaid. This can skew overall per-person spending numbers.
The report then breaks up welfare spending further by program. The three programs that the report focuses on are Medicaid (plus CHIP), Cash assistance (specifically TANF), and childcare spending.
Overall,
Data for all these programs show, yet again, that Minnesota is a generous state, as it has some of the country’s highest spending and benefit levels, and not to mention higher-than-averag income limits, casting a wider safety net compared to the rest of the country.
Here is firstly, a look at Medicaid.
Medicaid
Medicaid is by far the biggest welfare spending category for all states, including Minnesota. According to the data from Minnesota Management and Budget (MMB), for example, in the 2024-25 biennium, $14.6 billion or 70 percent of the general fund budget allocated to Health and Human Services (HHS) will go to Medicaid.
Generally, the federal government contributes more than 50 percent of all state Medicaid spending. Still, however, Medicaid takes up a huge chunk of state budgets. But in Minnesota, as the data shows, spending is even higher compared to other states.
In 2019, for example, 21.4 percent of state general funds in Minnesota went to Medicaid, according to NASBO data. Nationally, the figure was 18.9 percent. When federal funds and other funds are added, Minnesota spent 30.7 percent of its revenues on Medicaid. At the national level, the proportion was 28.9 percent.
Additionally, Minnesota also
generally outspends the rest of the country on Medicaid benefits per Medicaid enrollee in every eligibility category. According to data from Centers for Medicare and Medicaid Services (CMS), in 2019, the median state spending on Medicaid benefits per enrollee (regardless of their eligibility group) was $8,436. However, Minnesota spent $11,829 per enrollee — 40 percent more. For aged Medicaid enrollees, the median state spent $18,610 on Medicaid benefits per enrollee but Minnesota spent $32,854 — over three-quarters more. Minnesota spent $43,171 on benefits per enrollee with disabilities, double the median state figure of $21,372.
Figure 1: Medicaid spending per full-benefit enrollee by eligibility category, Minnesota vs Median state (2019)
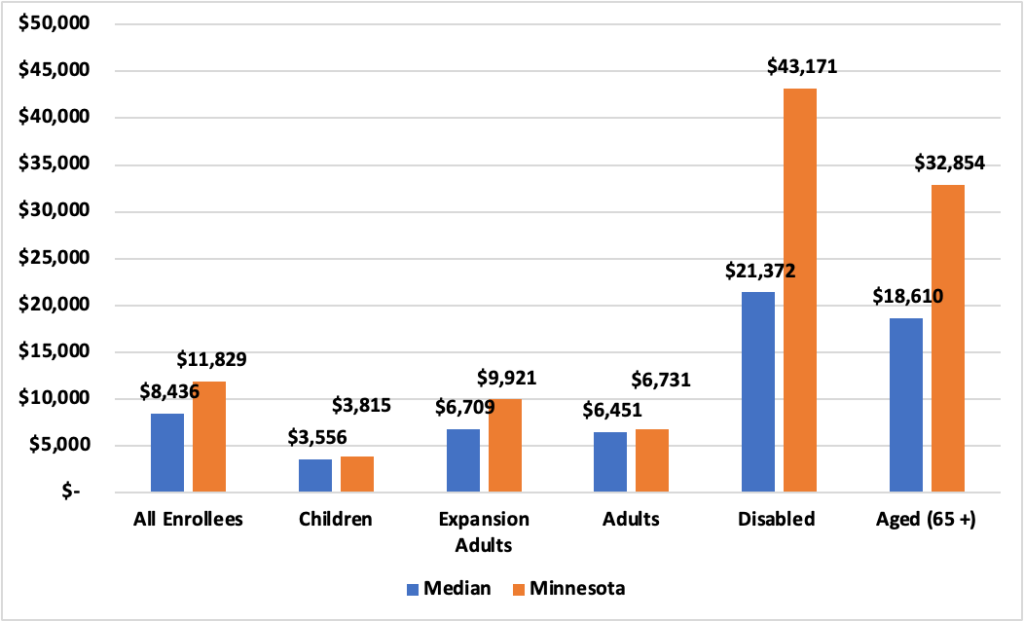
Certainly, among some categories of enrollees, Minnesota ranks well within the average. Among children and adults, for example, Minnesota ranked 21st and 23rd among the 50 states, respectively. But these slightly favorable numbers were eclipsed by Minnesota’s ranking among enrollees that are more costly to cover on Medicaid, such as the elderly and the disabled.
Looking at the data
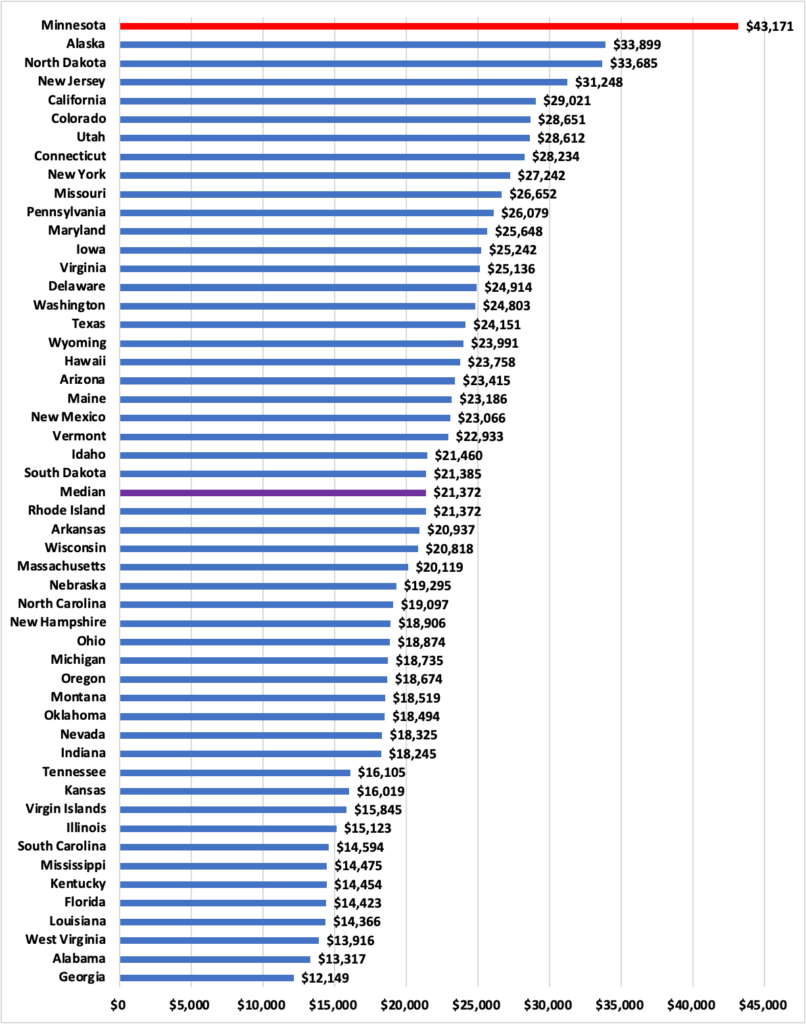
In 2019, Minnesota ranked first among the 50 states on Medicaid benefit spending per enrollee in the disabled category.
Figure 2: Medicaid benefit spending enrollee (Disabled), 2019
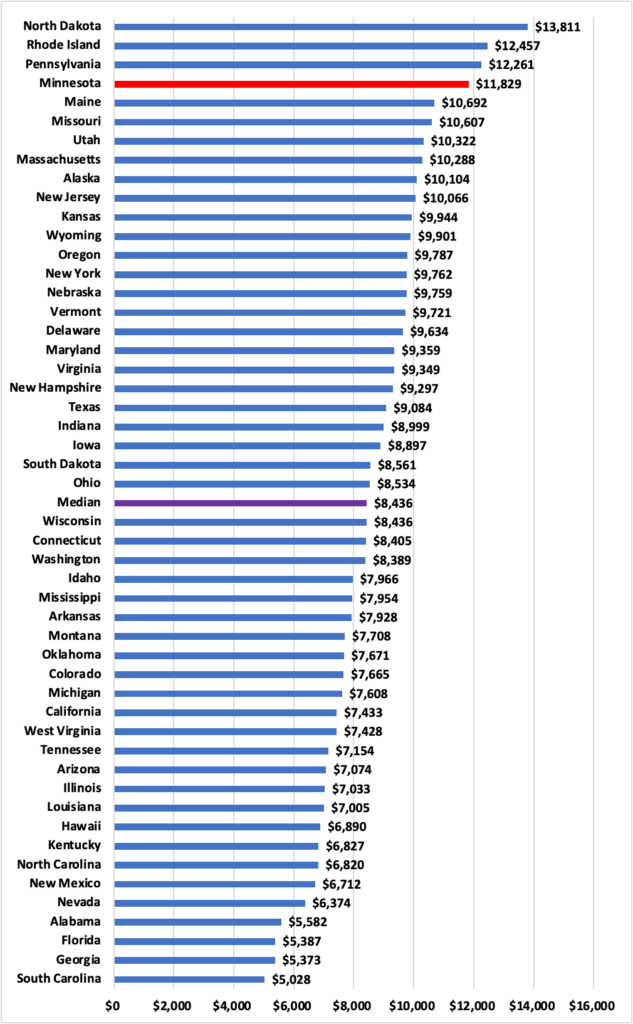
Minnesota also ranked third on Medicaid benefit spending per enrollee in the aged category…
Figure 3: Medicaid benefit spending per enrollee (Aged), 2019
And among the 32 states that had expanded Medicaid to adults under 65 through the Affordable Care Act (ACA)—which was passed in 2011 and extended Medicaid coverage to nearly all adults with incomes up to 138 percent of poverty) — Minnesota ranked third on Medicaid benefit spending per enrollee in the expansion group. Consequently, Minnesota ranked fourth on Medicaid benefit spending per average enrollee
Figure 4: Medicaid benefit spending per enrollee, 2019
Medicaid enrollment
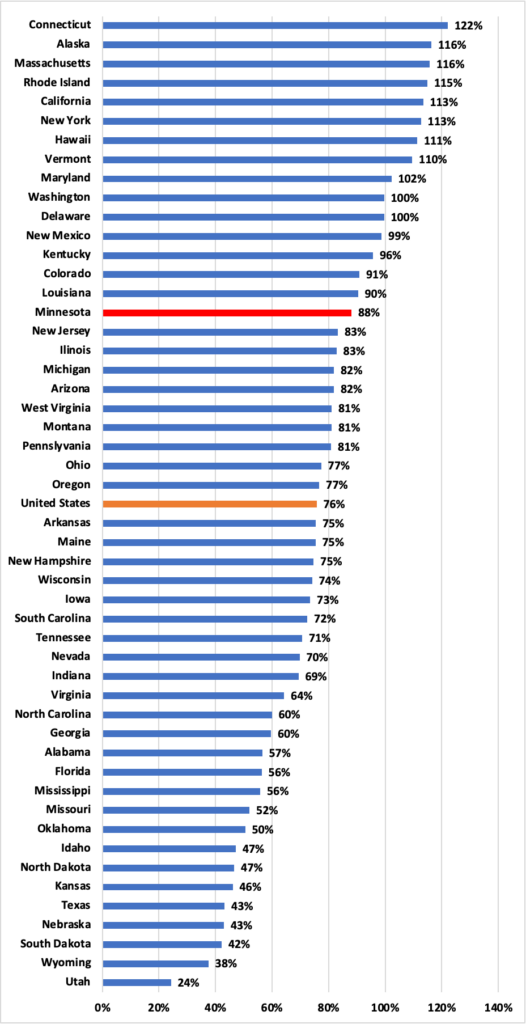
Not only does Minnesota spend more per person, but it also has a higher enrollment rate compared to other states. This is mainly because Minnesota has higher than average income limits for eligibility. In 2019, for example, an equivalent of 88 percent of the population with incomes below double the federal poverty were enrolled in Medicaid in Minnesota. Nationally, the rate was 76 percent.
Figure 5: Medicaid enrollment as a percent of the population below 200% of federal poverty, 2019