How we can afford tax cuts
One of the big topics for discussion at the state capitol this session is tax cuts. With a forecast surplus of $1.5 billion over the coming biennium, should we give this back to the Minnesotans who earned it by cutting their taxes? Some object, warning that this is fiscally irresponsible. A look at the numbers suggests that it doesn’t have to be so.
Spending
The state government is spending record amounts per Minnesotan
Let us start with some context. Using numbers from Minnesota Management and Budget, Figure 1 shows General fund spending (all figures adjusted for inflation in 2019 dollars) since 1960. Figure 2 shows General fund spending per capita since 1960. What both of these show is that in total and per person, and in real terms, Minnesota’s state government has never spent more money than it is right now.
Figure 1: Total General fund spending, 1960 to 2019, billions 2019$
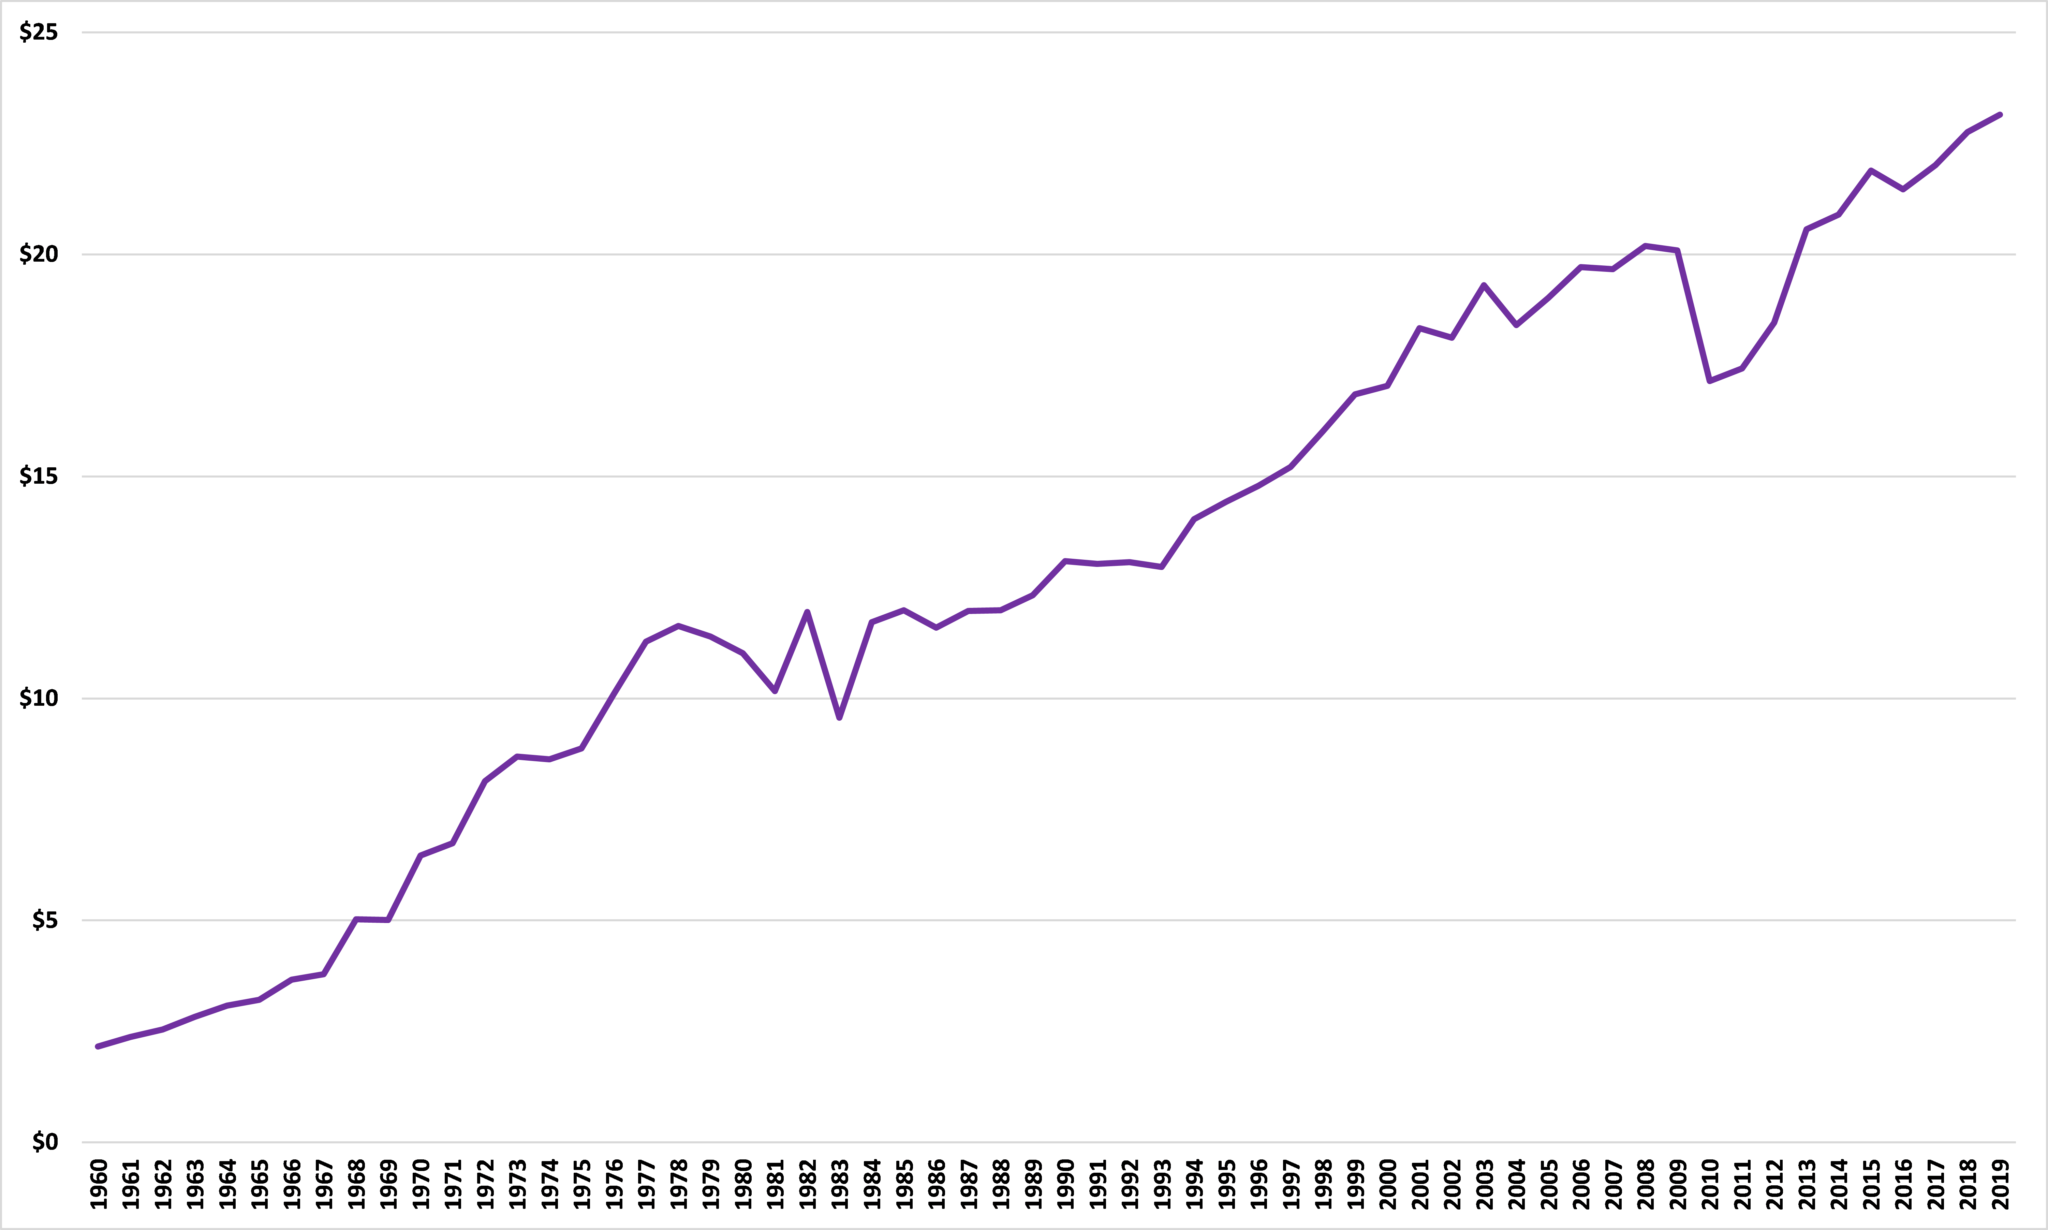
Source: Minnesota Management and Budget and Center of the American Experiment
Figure 2: Per capita General fund spending, 1960 to 2019, 2019$
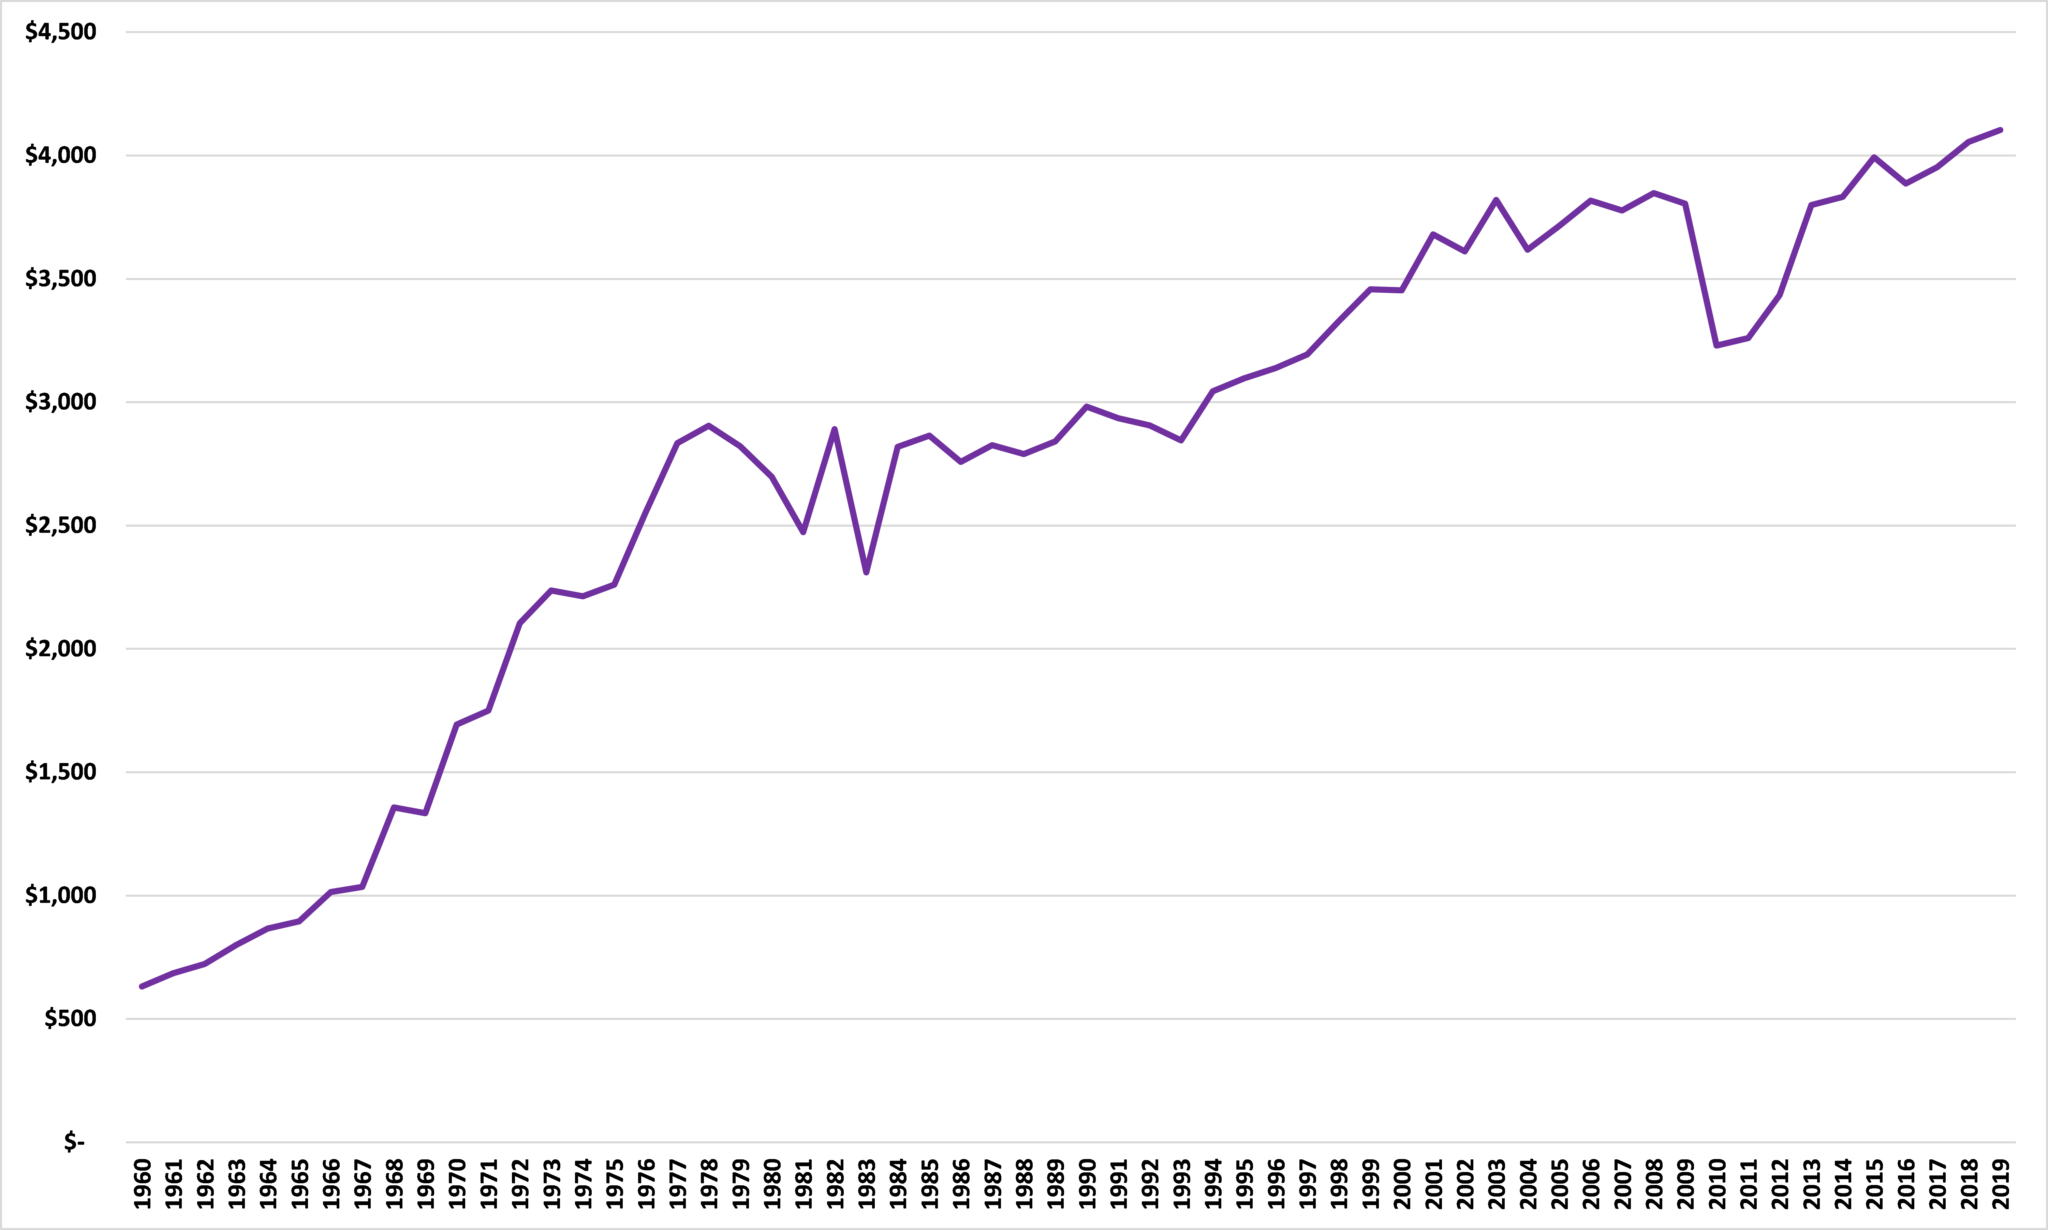
Source: Minnesota Management and Budget and Center of the American Experiment
Why should per person government spending increase, in real terms, forever?
This prompts a couple of observations.
First, it belies any claims by the state government to be short of funds.
But, second, we can ask ‘Does it need to go any higher?’ Where does it say that state government spending, either in total or per capita terms, should increase in real terms forevermore? In the first case, if the state’s population is increasing then it is likely that the total cost of state government operations will increase also. But this does not explain why government spending per person should constantly increase in real terms. We should ask what total state government spending would look like if we committed to maintaining the 2019 level of per capita government spending: $4,104.
Using population projections from the Minnesota State Demographic Center, Figure 3 projects how much total spending would be required to maintain the current level of per capita spending in 2019 dollars. We would be looking at fairly modest increases in total real terms spending, averaging 0.4% annually from 2021. The nominal increase will be higher owing to inflation.
Figure 3: Total General fund spending, 1960 to 2019 and projection to 2045, billions 2019$
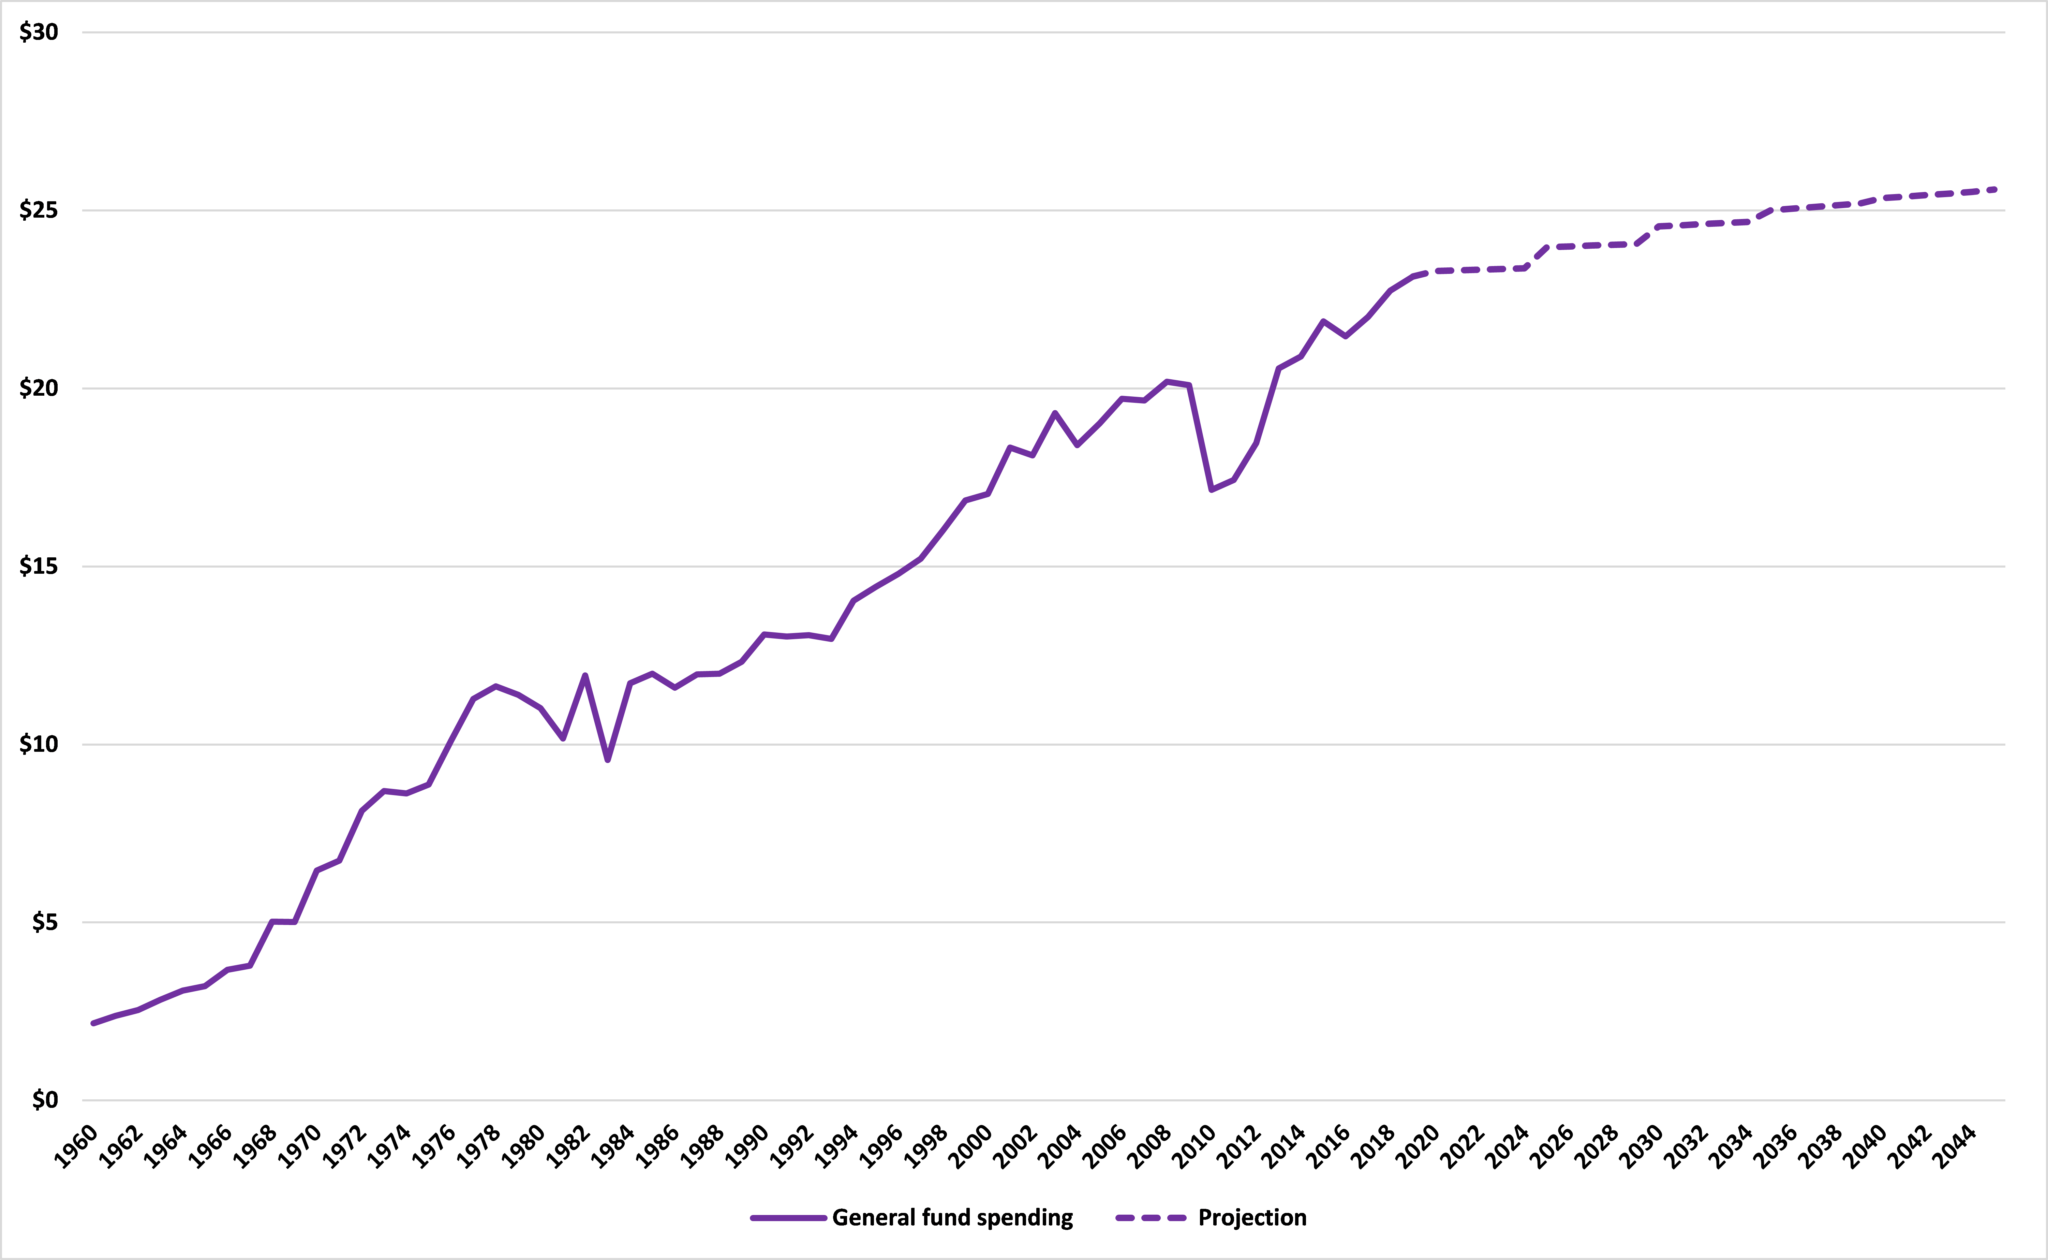
Source: Minnesota State Demographic Center and Center of the American Experiment
Revenue
The state government is collecting record amounts of revenue
What about the revenue side of the equation?
Figure 4 uses figures from the Minnesota Department of Revenue to show Total State Tax Collections (again, all figures adjusted for inflation in 2019 dollars) from 1974 to 2018, the last year for which we have data. It shows that, in 2018, Minnesota’s state government collected a record amount of revenue – $25.5 billion – which, again, belies any claims by the state government to be short of funds.
We can also see the trend of revenue growth, both over time and more recently. Between 2010 and 2015, for example, Total State Tax Collections increased at an average rate of 5.5% annually. Since then it has grown more slowly, at an average annual rate of 1.0%.
Figure 4: Total State Tax Collections, 1974 to 2018, billions 2019$
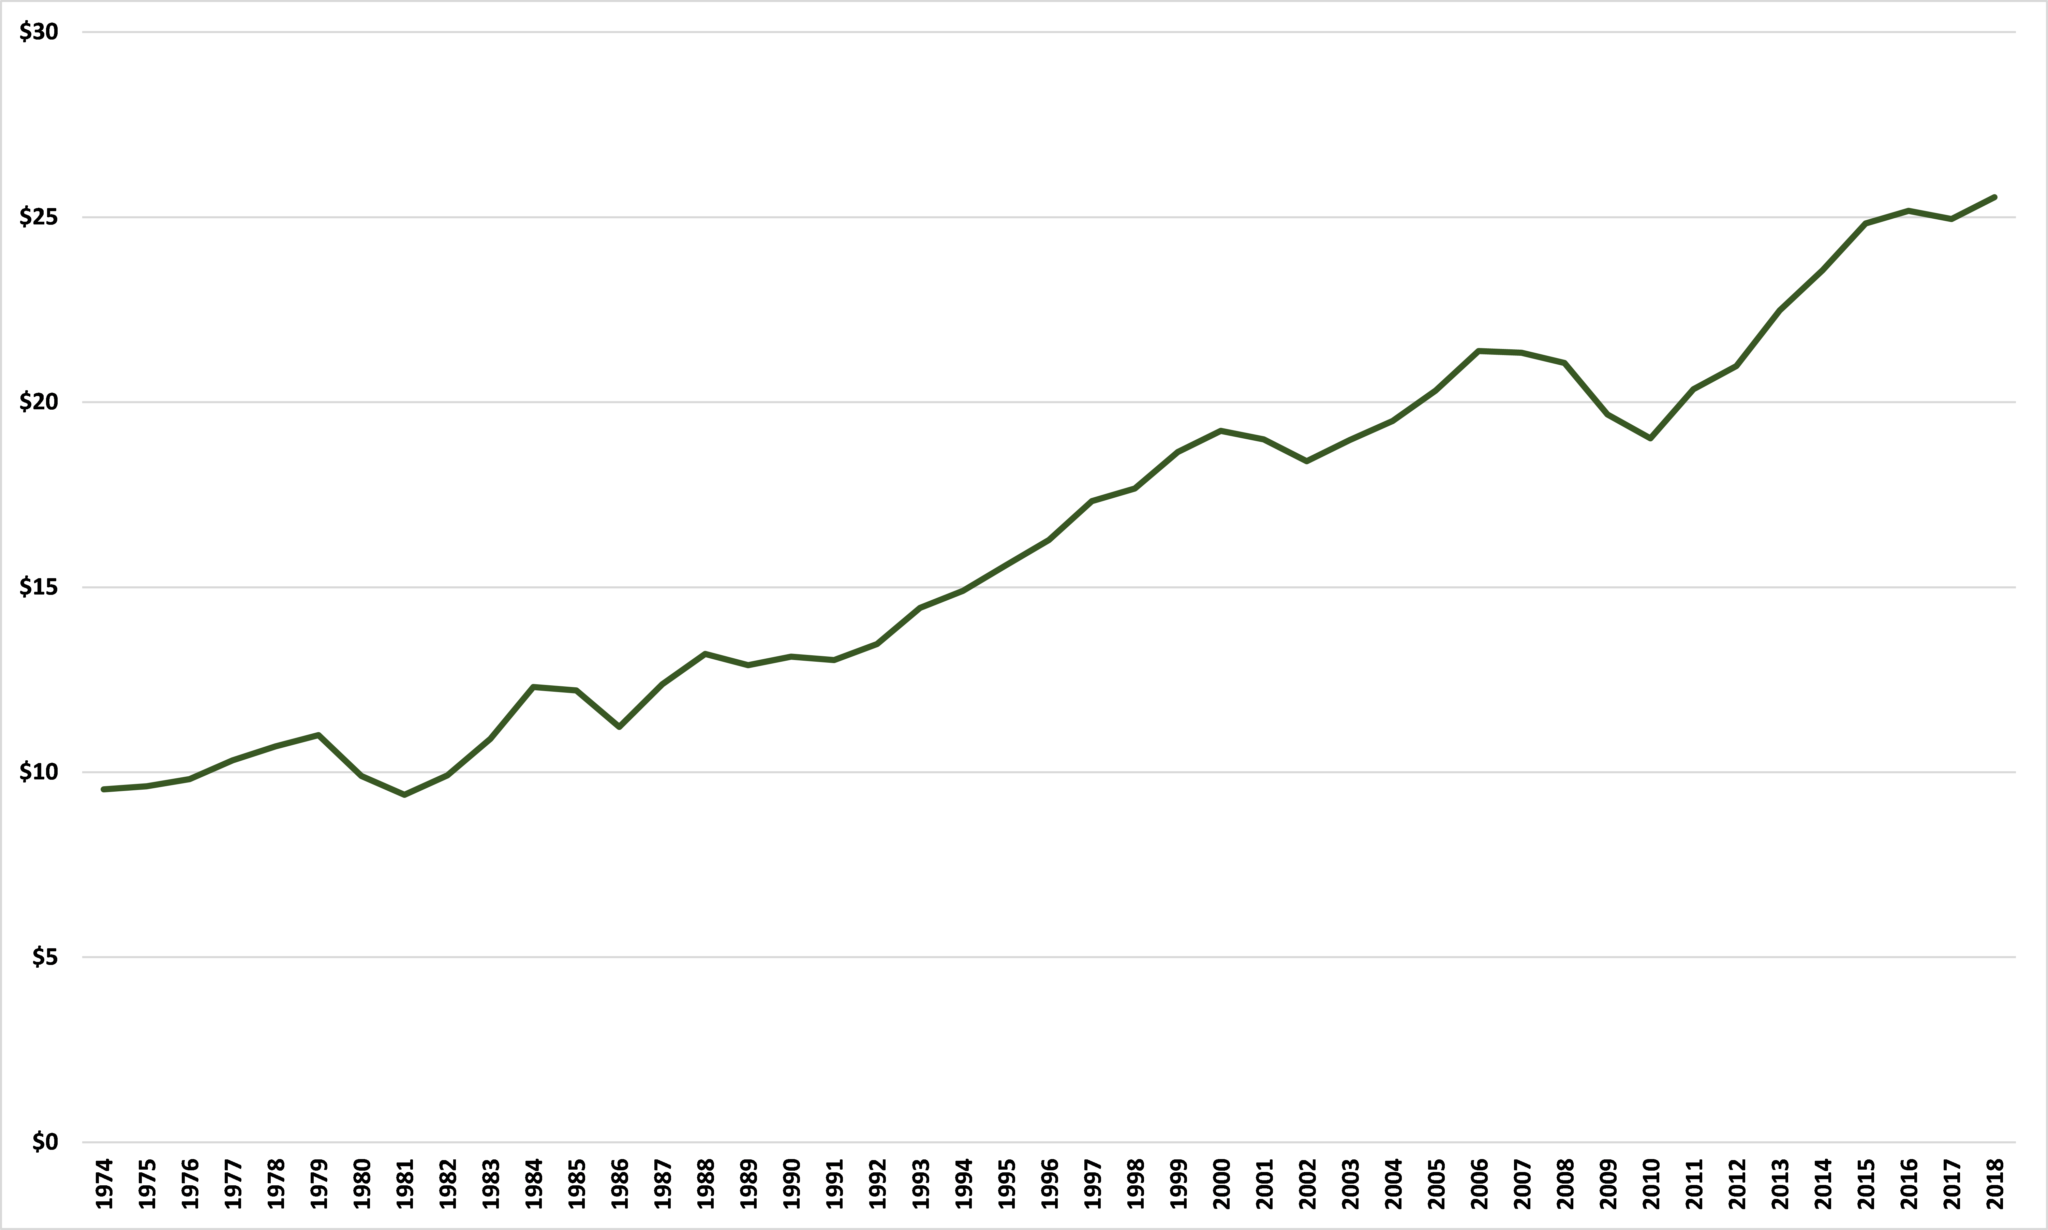
Source: Minnesota Department of Revenue and Center of the American Experiment
Putting it together
The figures above show two things. First, that, given population projections, to maintain per person government spending in real terms at the current record levels will require increased spending of, on average, 0.4% annually. Second, since 2010 the average annual increase in state tax revenues, in real terms, has varied from 5.5% between 2010 and 2015 to 1.0% between 2015 and 2018.
If we make the conservative assumption that Total State Tax Collections increase at that lower post-2015 rate going forward, we can make a projection of what state spending and revenues would be, shown in Figure 5. Again, the nominal increase will be higher owing to inflation. It shows the gap between revenues and spending which increases from $3 billion in 2021 to nearly $8 billion in 2045.
Figure 5: Projections for Minnesota state government revenues and spending, 2020 to 2045, billions 2019$
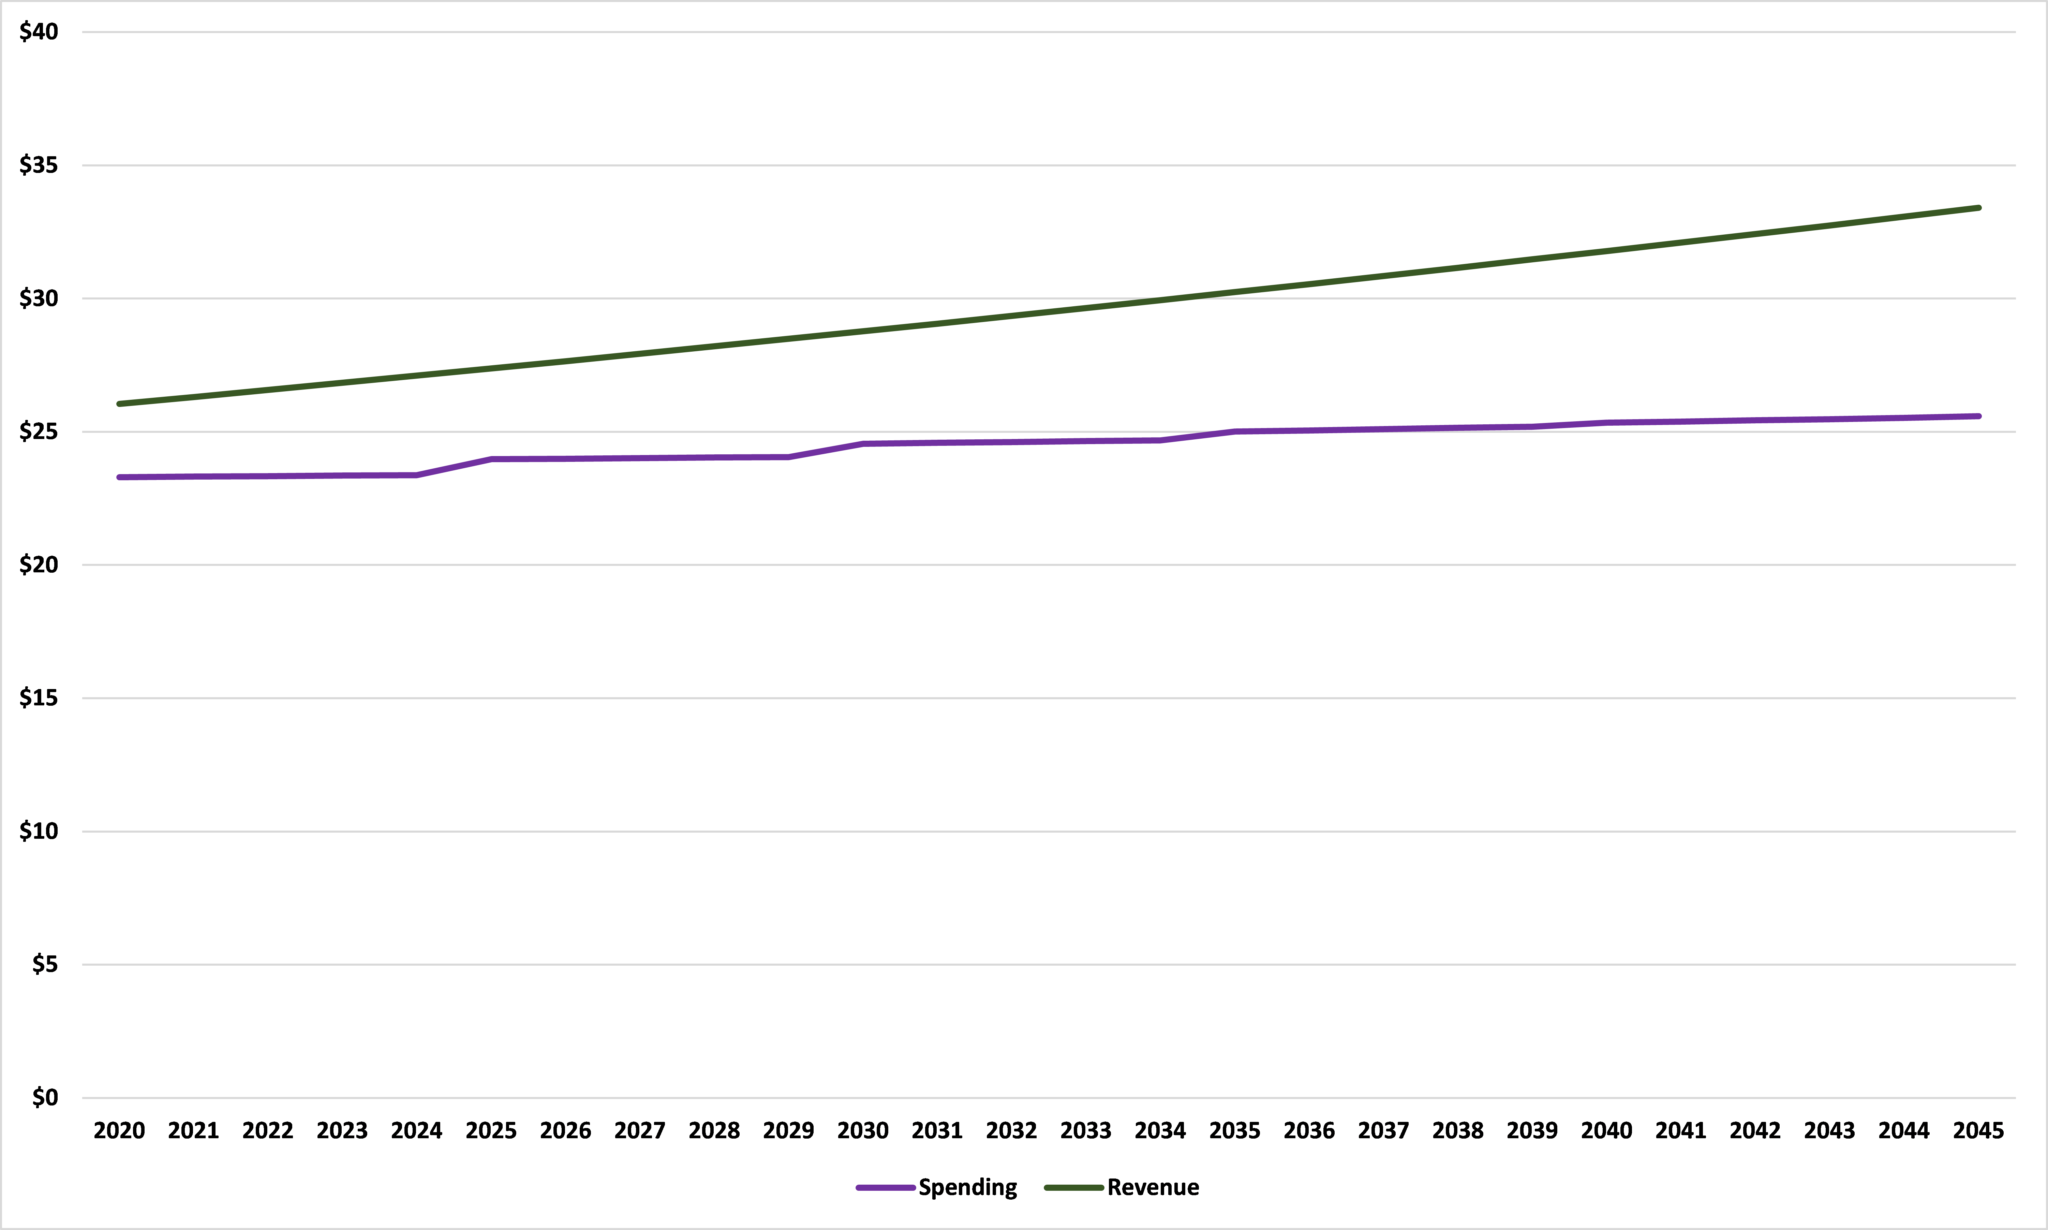
Source: Center of the American Experiment
What this shows is that, even with conservative estimates of revenue growth, there is scope for tax cuts if we decide to put a cap on per person government spending, in real terms, at the current record levels.
John Phelan is an economist at the Center of the American Experiment.