If Minnesota is the best state for Millennials, why do we have the 9th highest rate of Millennial out-migration?
Another day, another ranking of the states.
On Wednesday, Gov. Walz tweeted:
This was in response to a “study” — a word increasingly bereft of meaning since it is applied to ever more blog posts ranking states — which purported to rank Minnesota as the best state for Millennials. Is it really?
As I’ve noted before, if these rankings truly quantify what they claim to quantify, you would expect them to correlate with what they claim to rank on some measure of actual data. So, a ranking of top states for business should correlate with actual business activity and a ranking of best states to live and work in should correlate with where people choose to live and work. If these rankings do not correlate with the data, they are worthless.
So how does this ranking stack up? Not well.
Millennials — according to Pew Research Center — are those born between 1981 and 1996, making them aged between 27 and 42 (feeling old yet?). This overlaps, not perfectly but pretty well, with two categories which the Internal Revenue Service breaks its migration numbers down into — “26 under 35” and “35 under 45.” If we sum the number of individuals moving out of a state in these two categories and the number of individuals moving in, we can calculate a ratio of in-migrants to out-migrants by dividing the one by the other. A number greater than 1 means a net gain of Millennials and number less than 1 means a net loss. The results for 2020-2021, the most recent year for which we have data, are shown in Figure 1.
Figure 1: Ratio of Millennial in-migrants to out-migrants, 2020-2021
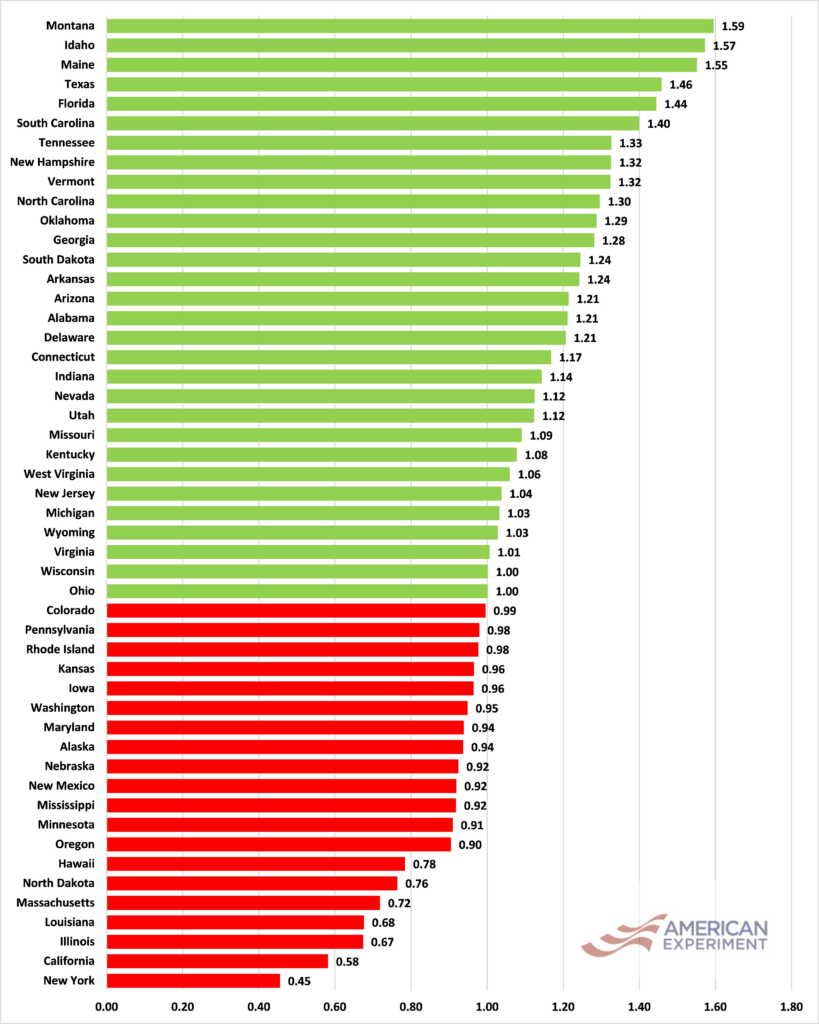
So, for example, South Dakota gained 15,221 Millennials and lost 12,138 giving a ratio (15,221/12,138) of 1.24. Minnesota, by contrast, lost 53,077 Millennials and gained 48,219 for a ratio of 0.91: in 2020-2021, Minnesota’s ratio of Millennial in-migrants to out-migrants was the ninth lowest in the United States.
As for the “study,” if we regress the ratio above with its rankings of Best & Worst States for Millennials we get a relationship that isn’t statistically significant, which means that we cannot rule out that any relationship we see is random. Somehow I doubt this will prevent the local media from reporting it next year.