Is there a link between school spending & student achievement?
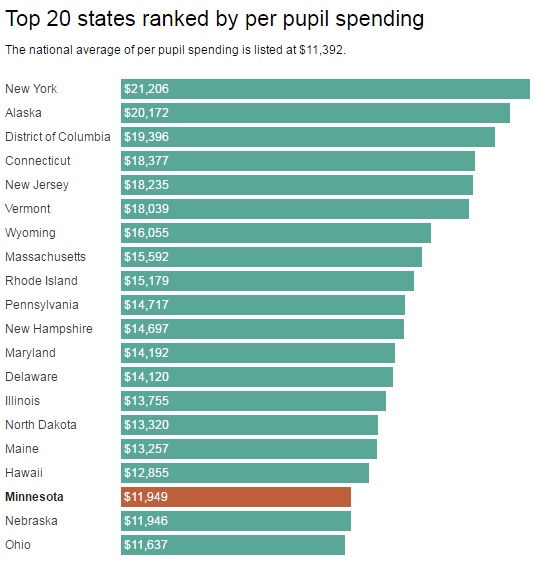
The U.S. Census Bureau recently released a report that lists per pupil spending by each state for fiscal year 2015. The Star Tribune’s article “Does Minnesota lead the nation in per-pupil spending? Not anymore” used the report to compare Minnesota’s pupil expenditures to other states’ spending.
Minnesota’s $11,949 per pupil spending was above the national average, but well below the $21,000 spent on students in New York and nearly double the $6,575 spent by Utah.
But there’s another question that needs to be asked: Does spending more on education improve academic achievement?
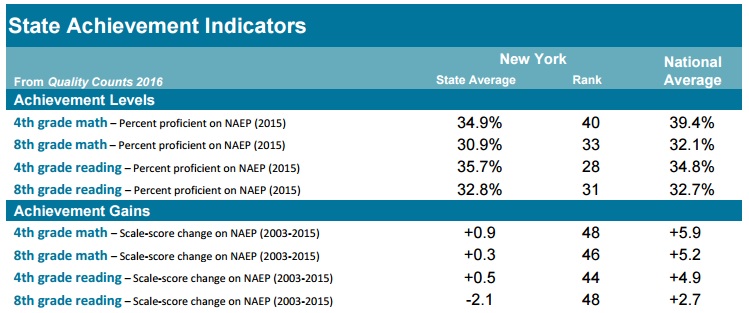
New York spent $21,206 per student in 2015—that’s more than any other U.S. state spent and almost twice the national average.
Here’s the Empire State’s K-12 educational performance on the National Assessment of Educational Progress (NAEP) in 2015. As you can see, test scores aren’t that impressive.
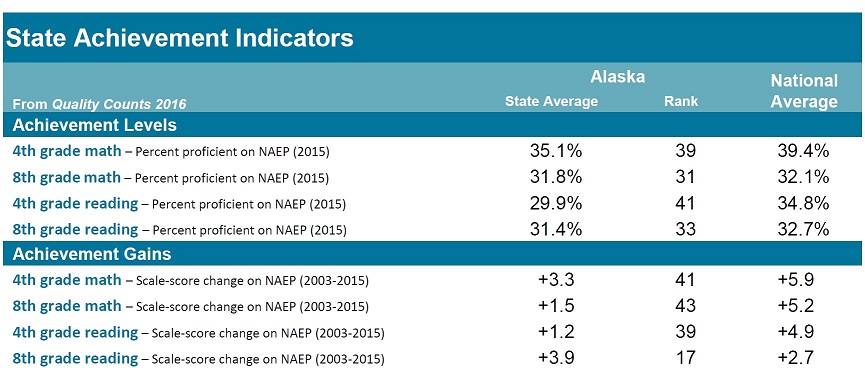
Alaska’s spending at $20,172 per pupil wasn’t too far behind New York’s. Its K-12 achievement levels and gains were also low.
And the third highest per-pupil-spending came from the District of Columbia, amounting to $19,396. Students made huge achievement gains across a 12-year span, but their 2015 math and reading proficiency scores were well below the national average. Only 27.3 percent of fourth graders read proficiently, and only 19.1 percent of eighth graders showed proficiency in math—ranking D.C. 49 in both areas.

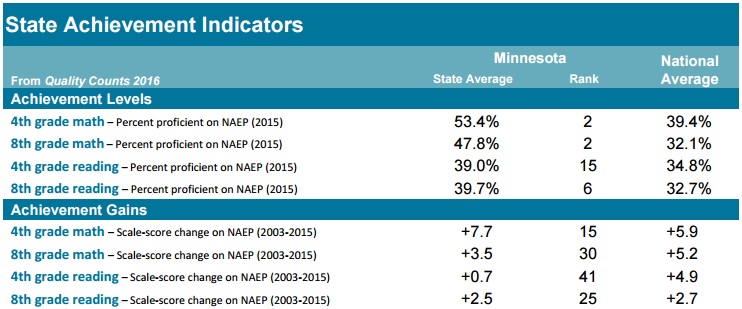
Where does Minnesota fit in? Compared to the North Star state’s spending, New York spent 77.5 percent more per pupil. Alaska and D.C. spent 69 percent and 62 percent more. Yet, Minnesota students’ reading and math proficiency levels were significantly higher than all three states.
Even the state with the highest K-12 academic performance—Massachusetts—spent less per pupil than seven other states.
What about states with consistently low academic performance and low spending? Don’t they need more money to close the achievement gap?
Take Mississippi. Mississippi is regularly seen at the bottom of most K-12 rankings, and its 2015 spending was $8,456 per student. Some would argue the state just needs to spend more money to improve its academic standing. But Utah—who shelled out the lowest amount per pupil at $6,575—had 40 percent of fourth and eighth graders demonstrate proficiency in reading and math versus Mississippi’s 24 percent. That difference ranked Utah 14 in overall elementary and secondary performance, whereas Mississippi ranked 51.
Granted, there are other factors to consider that play a role in achievement results. But when it comes to funding, throwing more money at the system is not directly tied to academic improvements.