Labor market challenges facing Southeastern Minnesota
Last month I was part of a round-table discussion hosted in Owatonna by Center of the American Experiment’s chapter there. The event brought together representatives of businesses from all over south eastern Minnesota who gave me some incredibly helpful feedback on the challenges facing them as the area’s economy recovers from COVID-19 and faces the new challenge of high inflation.
The primary challenge they identified was the hiring. Quite simply, they say they cannot find people to take the jobs they have available. I heard this in relation to manufacturing, health care, and , among other sectors.
What do the data tells us about the region’s labor market?
First, we need to specify which region we are looking at. Minnesota’s Department of Employment and Economic Development breaks the state down into a number of Economic Development Regions, shown in Figure 1. We will look at data for Region 10, the Southeast, which comprises Dodge, Fillmore, Freeborn, Goodhue, Houston, Mower, Olmsted, Rice, Steele, Wabasha, and Winona counties.
Figure 1: Economic Development Regions
Data from the Census Bureau for these counties and and Bureau of Labor Statistics enables us to construct estimates for the labor force participation rate for the Southeast. Figure 2 shows participation rates for the region and for the state generally in a number of categories for which comparable numbers are available.
Figure 2: Labor force participation rates, Southeastern Minnesota, 2020
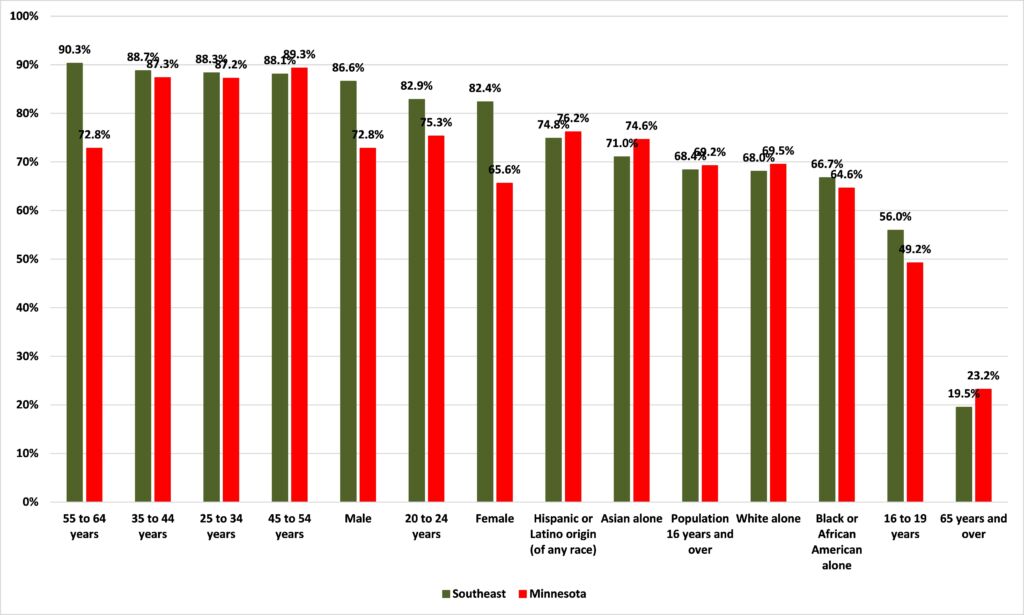
Figure 3 shows how these have changed from 2010 to 2020 – the last year for which the data are available – for a number of categories.
Figure 3: Percentage point change in labor force participation rate, Southeastern Minnesota, 2010 to 2020
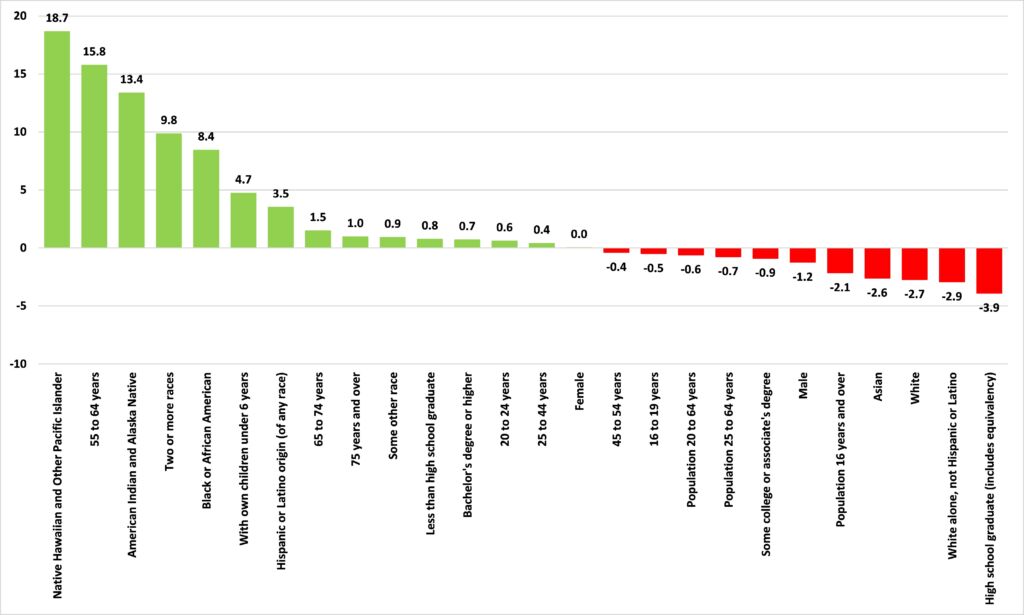
We see that while the participation rate for High School graduates or equivalent has fallen by 3.9 percentage points, that for Native Hawaiian and Other Pacific Islanders has risen by an impressive 18.7 percentage points. Overall, the participation rate for the Population 16 years and over is down by 2.1 percentage points.
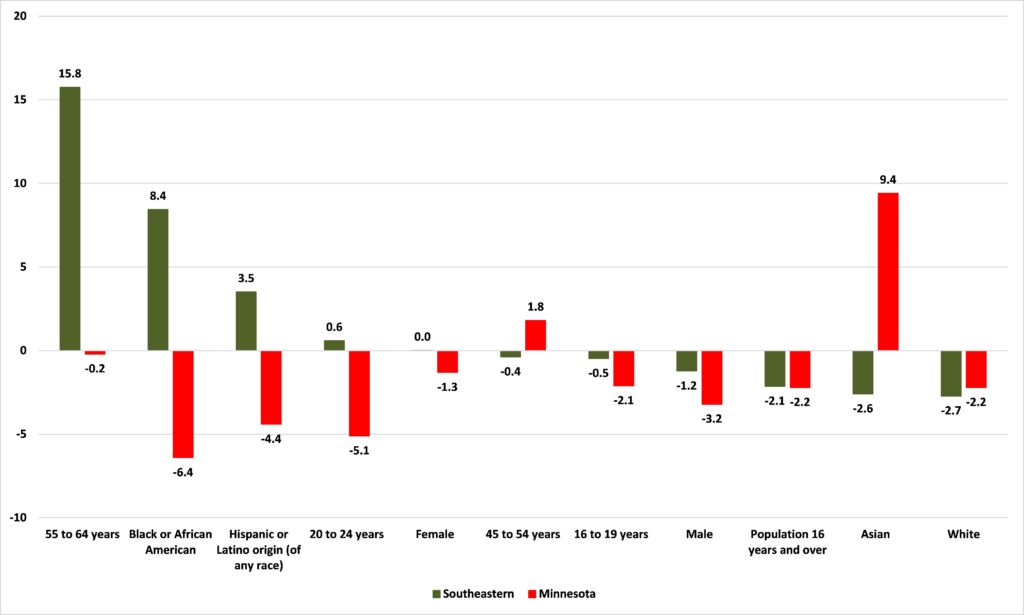
Figure 4 shows how this compares to the state generally in categories where the data overlap to allow comparison. Where Minnesota generally saw the participation rate of Black or African Americans fall by 6.4 percentage points between 2010 and 2020, in Southeastern Minnesota it rose by 8.4 percentage points. Indeed, out of these eleven categories, Southeastern Minnesota only under-performed the state in three of them: the Asian population and the population aged 45 to 54, where the participation rate rose across the state while falling in the Southeast, and among the White population, where the participation rate fell more in the Southeast than across the state.
Figure 4: Percentage point change in labor force participation rate, Southeastern Minnesota and Minnesota, 2010 to 2020
The data show some notable successes for the Southeast of the state then, as compared to the state at large, but also suggests areas for improvement. I will be Rochester and Owatonna on September 29th to discuss this in more detail.