Leaked Biden Plan to Destroy Lower Snake River Dams is a Bad One
Leaked court documents reveal that the Biden administration has been secretly conspiring with tribal nations and environmental groups to spend $1 billion to prepare for the destruction of four hydroelectric dams on the Lower Snake River (LSR) in the name of saving salmon.
However, the process is anything but transparent because the administration is seeking to use a controversial tactic called “sue and settle.” This tactic allows special interest groups to achieve regulatory or policy goals through litigation—in secret—and bypass the legislative and regulatory processes.
While the dams are unlikely to be destroyed in the near future because doing so would require Congressional approval, a 2022 joint report with the Washington Policy Center and American Experiment, The High Cost of Removing the Lower Snake River Dams, concluded that destroying the four LSR dams and replacing them with 100 percent onshore wind, solar, and battery storage would cost Washington residents an additional $34.3 billion through 2050.
This increase would lead to a massive 24 percent increase in electricity prices, forcing the average family to pay an additional $242 per year for their electricity.
Background
Washington state had the 7th lowest electricity prices in the United States in 2020 and the lowest carbon dioxide emissions from the electricity sector for any state in the nation. These economic and environmental feats were only possible because the original New Deal was very green, resulting in the construction of the Grand Coulee and Bonneville dams.
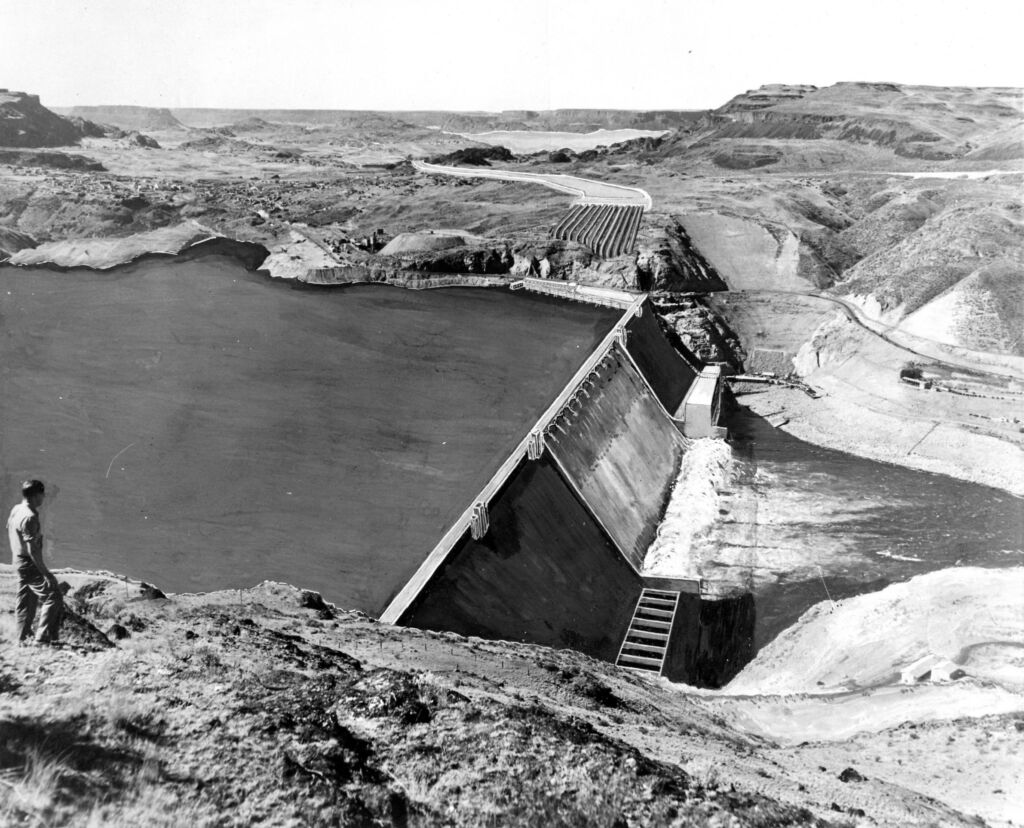
The Grand Coulee Dam Circa 1947
Hydroelectric dams continue to be the largest source of power in Washington to this day, providing 66 percent of total in-state electricity generation in 2020, but several groups have advocated for removing the four LSR dams: Ice Harbor, Little Goose, Lower Granite, and Lower Monumental, to aid in salmon recovery efforts.
The four LSR dams have a combined capacity of 3,033 megawatts (MW) and constitute 10 percent of the installed capacity in Washington State. However, these run-of-river dams only accounted for 4.68 percent of the state’s power generation in 2021, which was the most recent year data available when we did our modeling in 2022 due to a low water year.
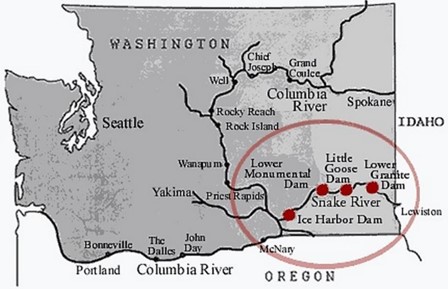
A map of the four LSR dams in Washington
American Experiment modeled two scenarios for replacing the electricity generated by the LSR dams: one that relies on onshore wind, solar, and battery storage, called the Renewable Scenario, and one that replaces the dams using natural gas, called the NG Scenario. Our model calculated the generation mix needed to replace the electricity generated from the LSR dams for every hour of 2021 using the resource mixes in both scenarios.
Replacing the Lower Snake River Dams with Renewables or Natural Gas
Under the Renewable Scenario, Washington electricity providers would be required to invest heavily in wind, solar, and battery storage technologies to make up for destroying the dams. Figure 1 shows the resource mix needed to replace the dams under the Renewable Scenario in a hypothetical situation in 2028 after the LSR dams have been destroyed.
The black line shows the 2021 hourly electricity production from the LSR dams, obtained from the Army Corp of Engineers, during a hypothetical week in 2028 after the dams have been destroyed. This hourly demand must be matched by the hourly generation from wind, solar, and battery storage to maintain the same level of reliability as the LSR dams.
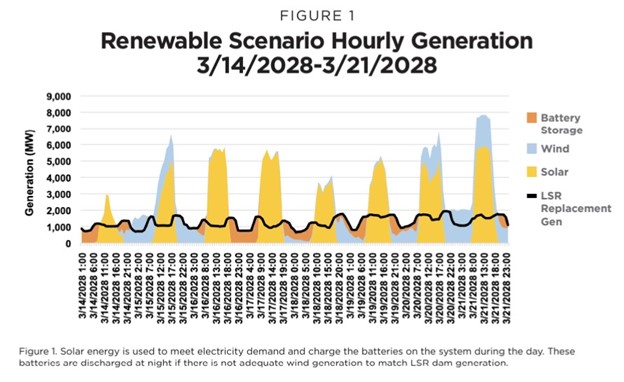
Wind and solar generation data were modeled using real-world 2021 hourly capacity factors of these resources in the Bonneville Power Administration (BPA) territory during the dates depicted in Figure 1. These dates were selected because they show the days when battery storage is needed most to match generation from the LSR dams. Any wind and solar generation that exceeds the LSR dam generation is used to charge the batteries on the system.
Once the batteries are fully charged, any additional solar or wind power that is generated is curtailed or turned off. Curtailment is expected to become increasingly common as more wind and solar are installed on the grid.
In the NG Scenario, Washington would replace the generation from the LSR dams with new natural gas power plants, which are capable of being turned up and down to match fluctuations in electricity generation from the LSR dams, shown in black in Figure 2.
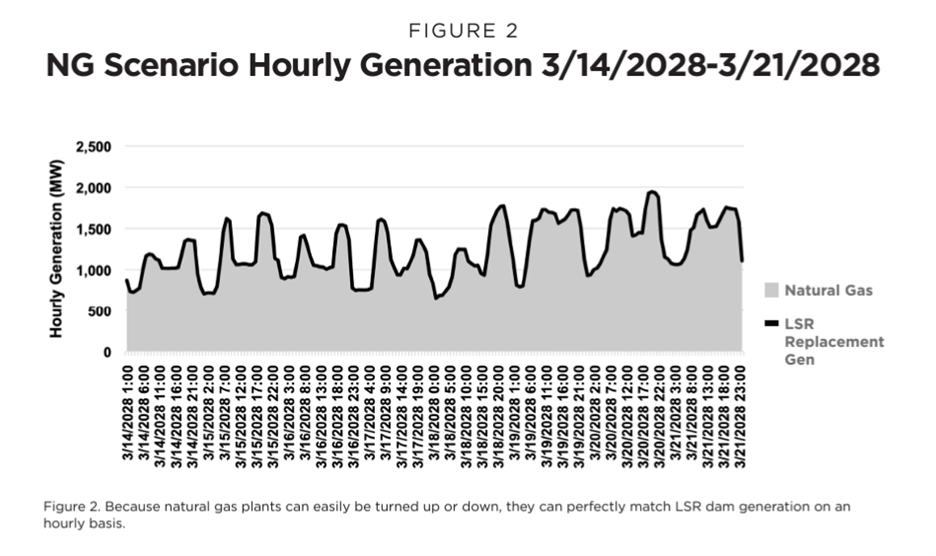
Notice that the Y-axis for Figure 1 is much higher than in Figure 2. This is because matching the hourly output of the LSR dams with non-dispatchable resources, those that can’t be started on command requires a massive overbuilding of wind, solar, and battery capacity to ensure the generation of adequate electricity when the wind isn’t blowing very hard or the sun isn’t shining very brightly.
Figure 3 shows that the Renewable Scenario would require a total of 17,006 MW of installed capacity, 2,137 MW of onshore wind, 6,056 MW of solar, and 8,813 MW of four-hour lithium-ion batteries to replicate the generation of the 3,033 MW LSR dams.
It is important to note that our model selected these quantities of solar, wind, and battery storage resources because they were the most cost-effective portfolio for matching the electricity generated by the LSR dams with carbon-free resources and maintaining grid reliability under 2021 LSR dam electricity generation and real-world wind and solar generation conditions.
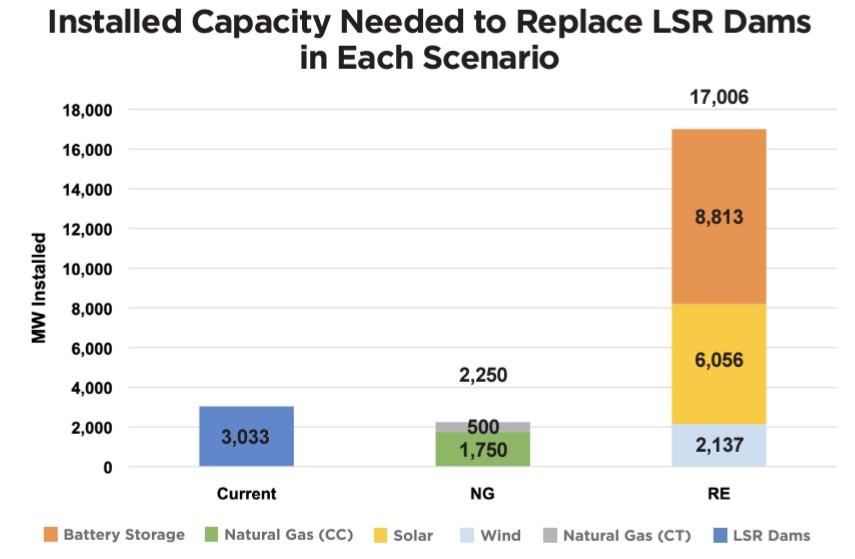
The NG scenario would require less capacity than the current dams because natural gas plants can be easily turned on or off to meet demand, but the dams don’t generate at their full potential year-round due to fluctuations in water levels.
For context, Washington had roughly 30,688 MW of installed power plant capacity on its grid in 2020, meaning the Renewable Scenario would require Washington to increase the installed capacity on its electric grid by 55 percent to replace the hourly output from the LSR dams that constituted 4.61percent of the state’s total electricity generation in 2021.
Unsurprisingly, drastically expanding the installed capacity on the Washington grid would be incredibly expensive.
The Cost
There are four main factors that affect the cost of adding new generation capacity to the electricity grid: capital costs for the new power plants, the utility profits vertically integrated monopolies earn on building this new infrastructure, the additional transmission costs associated with building the wind and solar resources, and the additional property taxes owed by utility companies because they now have much more property to tax.
Figure 4 shows the additional costs of building and operating the grids built in the Renewable Scenario and the NG Scenario from 2022 through 2050, on top of the costs already paid by Washington consumers for the rest of their generation fleet. As you can see, the Renewable Scenario costs 3.5 times more than the NG Scenario due to spending $2.1 billion on additional transmission costs, $15.1 billion on additional capital costs, $8.7 billion on additional fixed operation and maintenance costs, $1 billion in additional transmission costs, and $7.4 billion for additional utility profits.
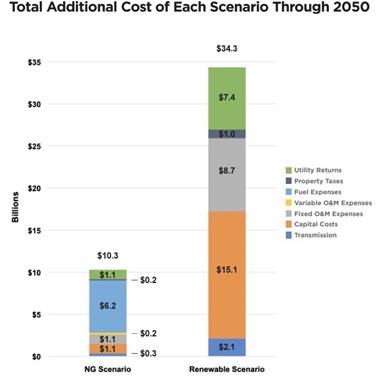
The NG Scenario costs $10.3 billion through 2050, but this is largely because we conducted this report in 2021, when natural gas prices were $9 per million British thermal units (MMBtu). Today, natural gas prices are less than $3 per MMBtu, meaning the fuel costs in Figure 4 could reasonably be reduced to around $2 billion instead of $6.2 billion, reducing the total cost of the NG Scenario to around $6.3 billion.
Rising Rates for Consumers
The total cost of replacing the generation of the LSR dams with 100 percent wind, solar, and battery storage would be $34.3 billion, causing electricity rates to increase from 8.33 cents per kilowatt hour (kWh) in 2020 to 10.34 cents per kWh by 2028, an increase of 2.01 cents per kWh, a nearly 24 percent increase. Under this scenario, Washington would go from having the country’s 7th lowest total electricity prices in 2020 to the 18th highest in 2028.
Averaged out over the 28 years studied, Washington families would see their average electricity bill increase by an average of $242 per year through 2050. Residential customers under the NG Scenario would see an average additional cost of $73 per year compared to the current electric grid, an increase of about $6 per month.
Conclusion
The Biden administration seems intent on spending more than $1 billion on prep work to destroy the LSR dams whenever liberal lawmakers feel they have the votes in Congress to do so. The pending lawsuit has been suspended until December 15th, so we will soon learn more about how the “legal cooperation” between the administration and environmental groups will influence the fate of the dams.
Rather than waste vast amounts of taxpayer money on one stretch of river, only to leave Washington’s electricity less reliable, Todd Myers of the Washington Policy Center argues salmon-recovery advocates should push for funding to be used where it can be most effective across the Northwest.