Economic illusion
At first glance, Minnesota’s economy seems strong. But a closer look at the data shows we’re on a unsustainable path.
The mythical Greek hunter Narcissus — whose name birthed narcissism — rejected romance because he was so in love with his own beauty, and his self-infatuation hastened his death. He drowned after diving into a pond, chasing his own reflection.
This mirage is reminiscent of the Minnesota economy. Pundits and policymakers who applaud its topline performance are blindly beholden to an illusion if they don’t analyze some underlying challenges that threaten our historic prosperity.
Minnesota’s economy today
Perhaps the best place to start is per capita income. High levels of it, fueled by economic growth, enable individuals to afford a more comfortable lifestyle.
In 2019, Minnesota ranked 15th among the states and the District of Columbia on per capita GDP. At $68,050, it was 4.2 percent higher than the U.S. average of $65,298. But Minnesota ranked 22nd in per capita GDP growth. Between 2000 and 2019, per capita GDP grew by 20.6 percent in real, inflation-adjusted terms compared to the national average of 25.0 percent.
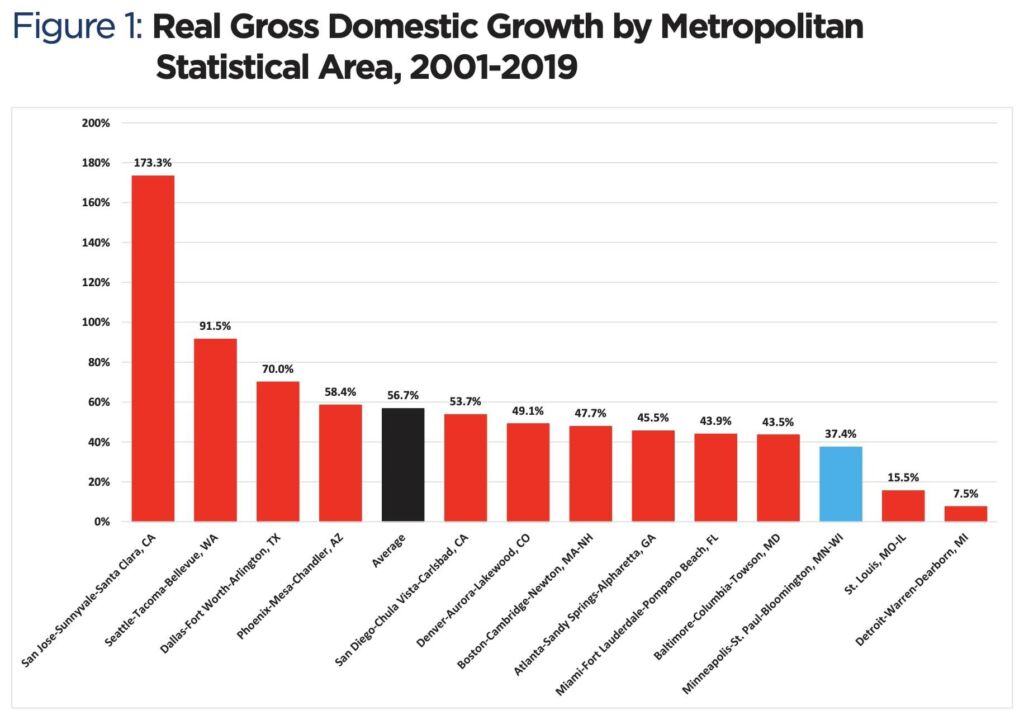
Even our state’s economic hub, the Minneapolis-St. Paul Metropolitan Statistical Area (MSA), fared badly compared with its competitors elsewhere in the country (Figure 1).
The situation is the same when it comes to per capita personal income — money people earn for their economic activity. This includes wages, benefits, dividend, interest and rent, as well as transfer payments like Social Security and veterans’ benefits.
In 2019, Minnesota had the 14th highest per capita personal income among the states and the District of Columbia. But for growth between 2000 and 2019, Minnesota ranked 30th.
The story darkens when we look at the source of this growth. Generally, compared to other states and the country overall, Minnesota is overreliant on increases in transfer payments for its per capita income growth. This is largely due to Minnesota’s higher-than-average hike in transfer payment income. A good example of this is welfare. Whenever the state writes one of these checks, it’s making a transfer payment.
Between 2000 and 2019, transfer income rose by 81.8 percent in Minnesota. This is well above the U.S. growth rate — 66.4 percent — and ranked ninth highest among the states and D.C. Income from labor (wages) and capital (dividends, rent and interest), however, grew by 15 percent — 29th highest — compared to the nation’s 18 percent.
Accordingly, increases in transfer income accounted for 39.5 percent of the growth in Minnesota’s per capita personal income, compared to 34.6 percent for the United States as a whole. It all adds up to seeing something pretty on the surface, the same way Narcissus did with his image on the water.
Per capita income growth sources
Three factors fuel Minnesota’s per capita income growth: an increase in the amount of labor provided by a given population (a higher employment rate/ratio or hours worked); growth of capital per worker (tools workers use); and total factor productivity (efficiency of converting production into output).
The latter is also known as technology (how production inputs become output).
Increased labor
With a given population, we can generate more output if a higher share of it (the employment ratio) is employed and producing. Also, this workforce could work longer hours. Both would boost output per capita by increasing GDP without adding more people to the mix.
To visualize this, imagine we have an economy for which the only output is ditch digging. If our town has a population of one and he produces one ditch per year with his bare hands, our output is one ditch per capita. If we add another worker, total output rises to two ditches but we’re still at one ditch per capita. Now a third person moves to town, only he doesn’t work. Our output remains at two ditches but our per capita production falls to 0.67 ditches.
Minnesota does a lot more than digging ditches, of course, and on the surface the state seems sound. For 2019’s employment ratio, Minnesota ranked third in the nation — 67.8 percent of its population was employed compared to the national average of 60.8 percent.
Again, these are just surface statistics. For one, Minnesota’s employment ratio has declined. Between 2000 and 2019, labor force participation fell by 4.8 percentage points — the 18th highest rate nationally and above the U.S. average of 3.7 percentage points.
Furthermore, this drop centered on prime working individuals. Between 2000 and 2019, Minnesota saw a slide in the employment ratio of all workers under 55, except for women aged 25 to 34. In contrast, the employment ratio increased for all workers over 55.
Compared to the country, Minnesota has also experienced declining employment of workers aged 16 to 19, as well as black/African American workers. Minnesotans also worked fewer hours per week — 33.7 in 2019 — compared to the national average of 34.3, likely the result of our higher-than-average share of part-time employment.
Those numbers bode poorly when you consider there are limits to how much we can increase labor to boost per capita income. We can potentially reach a point in which almost everyone is employed, with no room for growth.
Minnesota is much closer to this ceiling than most states, because a higher percentage of Minnesotans are employed. At the same time, we have only 24 hours in a day, a finite window for more work and, in turn, output.
In the long run, increasing productivity — the amount each worker can produce, given time worked and level of skill — is the more viable way to achieve sustained income growth. With productivity, we look at two things: (1) GDP produced per worker; and (2) GDP produced per hour worked. On both measures, Minnesota ranks low.
In 2019, the average worker in Minnesota produced a GDP of $127,968. This is 6.2 percent lower than the nation’s $136,417 and ranked 21st highest among the states and D.C. In 2019, Minnesota produced $75.95 GDP per hour worked, 4.3 percent less than the national average of $79.39.
Growth in productivity for Minnesota also lagged behind the national average between 2000 and 2019. While GDP per worker increased by 25.1 percent for the U.S., Minnesota’s GDP per worker grew at 21.8 percent. Similarly, GDP per hour for the nation grew at 13.9 percent while Minnesota’s grew at 10.5 percent.
One way to blunt this decline is to add more capital per employee. This investment boosts productivity per capita, taking into account the skill level and labor hours of each worker. The trick is to make sure you get a good return.
Take our ditch diggers. Let’s say we give each one a shovel. This allows them to dig 10 ditches per year instead of just one. Now let’s say we give them two shovels, thinking this will mean 20 ditches per year. Wrong. Workers can’t use both of them simultaneously, meaning we invested money into our operation without producing more ditches. Those are diminishing returns.
Turning to Minnesota, the state’s capital per worker was $151,489 in 2019. This was 12.5 percent less than the capital available to every American worker — $173,122 — and ranked 20th out of the 50 states and D.C. When we account for outliers like Wyoming, North Dakota and Alaska — states that rely heavily on capital-intensive industries such as oil, mining and gas — Minnesota looked better, with capital per worker almost matching the U.S. median average of $151,861.
Minnesota even improved. Between 2000 and 2019, capital per worker grew by 29.8 percent in our state, higher than the U.S. average of 26.5 percent. But, as with labor, there are limits to usefully increasing capital per worker.
Increased human capital
Remember, giving one worker two shovels doesn’t double his output. Sustained per capita income growth needs sources without such constraints.
One source is better skills, often through training and schooling. As a result, productive capacity climbs. There is no ceiling here, theoretically at least, because there’s no limit to the knowledge or skill each worker can possess. It’s just tough to quantify human capital.
Some researchers use years of schooling as a proxy for “educational attainment.” The problem is, schooling is an input and does not necessarily reflect any specific skills acquired. In other words, a Harvard degree is more vanity than efficacy — more Narcissus than Paul Bunyan — if it doesn’t translate to productivity in the economy.
Some studies have improved upon these measures by augmenting educational attainment with qualitative measures like test scores. On these measures, Minnesota is outstanding. In a 2017 study published in the American Economic Journal, Minnesota ranked third nationally for the aggregate per worker knowledge capital, or job skills, of its residents educated in the state.
But there are a couple of problems here. First, the downward trend in employment ratio means Minnesota is moving toward a labor force that will lack skilled employees. And second, this underlying issue is exacerbated when you factor the training of future workers, which starts with schooling, is trending in the wrong direction as well.
The measure of quality used here is dependent on test scores from the National Assessment of Educational Progress (NAEP), and students from varying socioeconomic and ethnic backgrounds tend to perform differently regardless of state. Minnesota does well on average, likely due to its socioeconomic makeup instead of great achievement by its education system. Indeed, when we disaggregate the data to take these factors into account, Minnesota’s NAEP scores slump from fourth to 33rd in the United States, according to the Cato Institute.
Now compare Minnesota with Texas, which serves similar demographics. Minnesota’s black, Hispanic and Asian/Pacific Islander students underperformed their counterparts in the Lone Star State on reading and math NAEP subject tests. Similarly, Minnesota’s black and Hispanic students trailed Mississippi students of the same racial backgrounds in both fourth-grade and eighth-grade math and reading. Minnesota also does a poor job educating low-income students, compared to Mississippi.
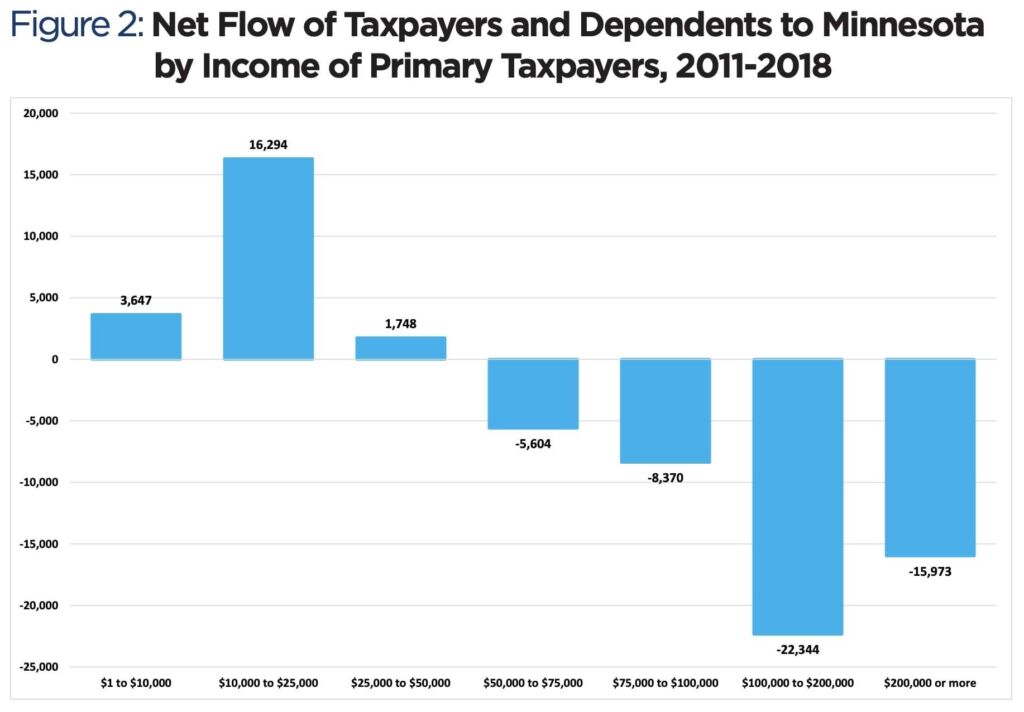
That means Minnesota must rely more on attracting highly skilled workers or retaining the ones here now. Sadly, the state does the inverse.
Furthermore, these losses are not just the “rich” fleeing the state’s exorbitant tax rates. Between 2011 and 2018, Minnesota saw a net outflow of people who earn at least $50,000 annually.
Technology
The only way societies can experience sustained economic growth is by developing new ideas. While we might run out of resources, there is no reason to run out of ideas. Human ingenuity is, as the economist Julian Simon called it, “The Ultimate Resource.”
This source of growth is commonly known as technology or total factor productivity. Technology/TFP usually involves finding new and more productive uses of our resources, or developing new processes such as Sam Walton’s approach to retailing, or Henry Ford’s use of assembly lines to turn out a Model T every 24 seconds. Broadly speaking, these ideas fall into two categories: innovation and entrepreneurship.
By one measure, Minnesota is one of the most innovative states in America. In 2019, the state generated 874 patents per million of the population, ranking sixth and well above the U.S. average of 567. But our low GDP per capita growth suggests we’re great at generating new ideas while other states are better at applying them and reaping the benefits.
Minnesota also fares relatively poorly on entrepreneurship. In 2020, new/young businesses — those which are five years old or less — accounted for just 31.3 percent of all commerce in our state, 38th in the U.S. Nationally, the figure was 37.7 percent.
What’s worse, between 2000 and 2020, new/young businesses fell by 4.6 percent in Minnesota, more pronounced than the national trend.
The mirage
Minnesotans typically have high incomes relative to residents of other states, but much of this is a legacy of past prosperity. In recent years, per capita income growth has both lagged that of the country and been overly reliant on transfer income. This is unsustainable.
Given the limitations of labor and capital, a continual rise in per capita incomes requires more labor productivity, and there are three ways to achieve this.
- Reverse declining education data.
- Enact policies that attract and retain highly skilled workers.
- Foster more entrepreneurship.
Cutting tax rates and providing more school choice would be a great start. Otherwise, we’re doomed to remain enamored with the shiny economy of today, a prelude to our very own Narcissus-into-the-water moment. And in the Land of 10,000 Lakes, there are a lot of ways to drown.