Focus on spending, not taxes
State government spending is already historically high.
Minnesota Management and Budget in December forecasted a state budget surplus of $641 million for FY 2020-21, which ends next June. But attending to a looming deficit of $1.273 billion for FY 2022-23 will be the primary job of the upcoming 2021 legislative session. As Minnesota’s constitution requires a balanced budget each biennium, lawmakers in St. Paul must ask themselves the question: How will we close this deficit? They will have three options: higher tax rates, lower spending, or some combination of both.
Our recently published paper, “Minnesota’s Budget Deficit: Why we should make spending cuts and not raise taxes,” concludes that the state should rely on spending cuts to achieve fiscal consolidation. Minnesota’s tax rates are already some of the highest in the United States; tax revenues are driven by economic growth, not hikes in tax rates; and tax hikes have been shown to retard economic growth.
State government spending is already historically high. Minnesota’s General Fund spending in 2019 was higher in real, inflation-adjusted terms in 2019 than in any previous year. Of course, our state’s population has risen over this period, but even accounting for that, Minnesota’s state government has never spent more money than it is right now—$4,088 per Minnesotan in real terms, up 26.6 percent since 2010.
And there is plenty of scope for cuts to Minnesota’s state budget. The two main areas of state government spending in Minnesota are education and welfare. Together, they accounted for 75.0 percent of state government spending in 2018.
If Minnesota closed its forecast budget deficit entirely with spending cuts, we would be returning spending in real, inflation adjusted, per capita terms, to the level of 2016-17.
Education spending. Every year between 2010 and 2018, spending on education has amounted to more than 35 percent of General Fund spending. Education spending grew over this period by 21.3 percent in real terms, the seventh highest rate among the states. But even after this, Minnesota’s per pupil spending in 2018 amounted to $12,974 per pupil, only slightly above the national average of $12,612.
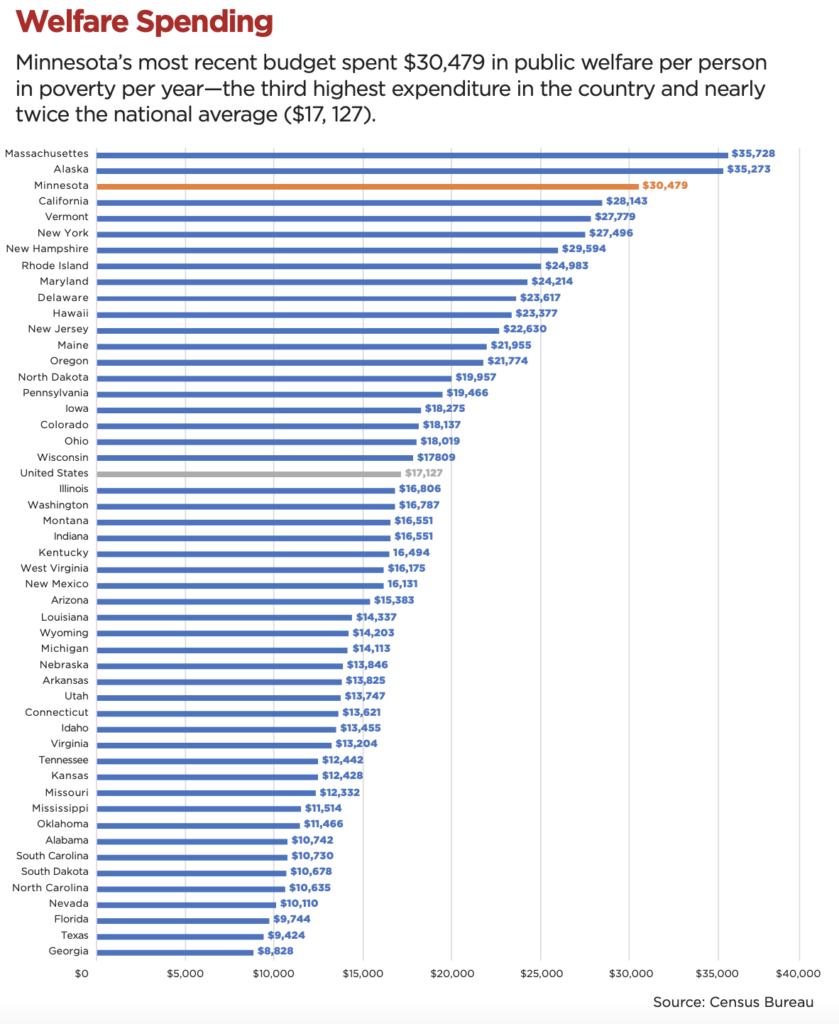
Welfare spending is the second biggest spending category. Every year between 2010 and 2018, spending on welfare has amounted to more than 30 percent of General Fund spending. Spending on welfare includes monies spent on assistance programs targeted toward low-income individuals and spending on Medicare and Medicaid, which make up a majority of public welfare spending.
In 2018, Minnesota’s state government spent $30,479 in public welfare for each person in poverty. This compares to a national average of $17,127 and ranks our state third nationally for welfare spending. Only Massachusetts and Alaska spent more in welfare per person in poverty than Minnesota. Indeed, Minnesota’s welfare spending is so high that if the state spent the national average per person in poverty—$17,127—it would have spent only $9.0 billion in 2018, which is $7.1 billion less than the $16.1 billion it actually spent.
Taxes will not solve Minnesota’s budget problems. Our paper argues against taxes as a way to solve the state’s budget problems.
• Minnesota has the fifth highest top rate of state personal income tax in the United States—9.85 percent on income over $164,400 a year. Only Oregon, New Jersey, Hawaii, and California have higher top rates.
• Minnesota’s heavy tax burden doesn’t merely rest on the shoulders of “the rich.” Our state’s lowest personal income tax rate—5.35 percent on the first dollar of taxable income—is higher than the highest rate in 25 states.
• At 9.80 percent on the first dollar of taxable revenue, our state has the fourth highest state corporate income tax rate in the United States. Only Pennsylvania, New Jersey, and Iowa have higher rates.
• Higher tax rates do not necessarily bring higher revenues. Minnesotans actually handed over a larger share of their incomes to the government in the 1990s with top income tax rates of 8.50 percent than they did in the 1970s with rates of 17.0 percent.
• There is a much stronger relationship between state GDP and tax revenues than top tax rates and state revenues. For total state tax revenues as a share of state GDP, the mean average is 6.6 percent and the median is 6.7 percent. In other words, there is very little variation in these numbers. This means that if policymakers want more money to fund government services, they should look to increase the state’s GDP rather than its tax rates.
• The overwhelming balance of academic literature shows that tax hikes negatively impact economic growth. Of 26 papers reviewed by the Tax Foundation, 23—88 percent—found a negative impact of higher tax rates on economic growth
• Should the state government attempt to close the deficit using tax hikes, not only will Minnesotans see their net incomes reduced, but their gross incomes will be reduced too. We estimate that closing Minnesota’s budget deficit for FY 2021 with tax hikes alone would cost each Minnesotan $3,828 in lost Personal Income by 2025, or $15,312 for a family of four.
Conclusion. Minnesota’s tax rates are already some of the highest in the United States; hikes in tax rates do not appear to drive increases in tax revenues; tax revenues are driven by economic growth; tax hikes have been shown to retard economic growth; and in total and per person, and in real terms, Minnesota’s state government has never spent more money than it is right now. Together, these facts should steer us toward relying on spending cuts to achieve fiscal consolidation.