It’s not the weather
Minnesota’s high tax burden is the top reason more people leave the state each year than choose to move here. It’s a costly problem.
Minnesota’s population growth is below average.
In April, Minnesotans breathed a sigh of relief when the 2020 census showed that the state would not lose one of its eight congressional seats. But it was a close run thing: if New York had counted just 89 more people in the census, it would have edged out Minnesota and received the 435th of the 435 House seats.
Minnesota’s population growth has long lagged that of the United States. Since the turn of the 21st century, Minnesota has ranked 26th among the fifty states and District of Columbia with population growth of 14.7 percent over this period compared to 16.8 percent for the United States.
Some argue that this is part of broader phenomenon in which people are drawn to the more comfortable climates in the south and west. But that doesn’t explain why Minnesota’s population growth has also lagged behind South and North Dakota, which grew 18.1 and 19.2 percent respectively.
In fact, a Census Bureau survey of people who moved in 2020 revealed that just 0.4 percent cited “change of climate” as their primary motivation. The most popular choices were “wanted newer/better/larger house or apartment” (14.6 percent), “new job or job transfer” (11.4 percent), and “to establish own household” (10.6 percent). Each relates to employment or housing, which suggests that state government policy in these areas could influence migration decisions, either positively or negatively.
Taxes affect where people locate
Empirical research indicates that a state’s comparative tax burdens affect migration decisions. A recent paper cited “growing evidence that taxes can affect the geographic location of people both within and across countries. This migration channel creates another efficiency cost of taxation with which policymakers need to contend when setting tax policy.”
Evidence also suggests that taxes on wealth and capital income drive migration. In particular, a paper by economists Enrico Moretti and Daniel J. Wilson weighs the revenue brought in by state estate taxes against the revenues lost when people leave the state and take future payments of income and sales taxes with them. They find that, while “the [revenue] benefit [of an estate tax] exceeds the cost for the vast majority of states,” this was not the case for Minnesota. Ours is one of four states where the costs in terms of lost revenues from other taxes outweigh the benefits in terms of estate tax revenues. Those states are the ones with the highest top rates of income tax: Hawaii, Minnesota, Oregon, and Vermont. This echoes the findings of our own study in 2018 and strongly suggests that a state can impose either an estate tax or a high top rate of personal income tax, but it cannot impose both without people leaving and taking their revenues with them.
Minnesota has high taxes
Minnesota’s overall tax burden is high. Data show that, at 10.2 percent in 2019, Minnesota had the 6th highest ratio of state and local sales, property, and individual income tax revenues to Personal Income out of the fifty states and District of Columbia. Our state’s tax burden has ranked in the top ten on this measure in every year since at least 2009.
Minnesota’s high rates of individual income tax largely drive this high burden. The Tax Foundation says we had the fifth highest rate of state individual income tax in 2021, at 9.85 percent on incomes over $166,040. Only California, Hawaii, New Jersey, and Oregon have higher rates. Furthermore, for both California and New Jersey, the top rate only kicks in at an income threshold of $1 million. Notably, Minnesota doesn’t just tax “the rich” heavily: our starting rate of personal income tax — 5.35 percent — is higher than the top rate in 23 states.
Minnesota also imposes a high burden in other taxes that drive migration patterns, such as the estate tax. The Tax Foundation reports that ours is one of only twelve states and the District of Columbia to impose an estate tax (a further six impose an inheritance tax, and Maryland imposes both). To compound this, of these 13 jurisdictions, Minnesota’s exemption, $3 million, is lower than in eight. At 13 percent, Minnesota has the second-highest minimum rate of estate tax after Vermont. Minnesota’s top rate of estate tax, 16 percent, is the joint second highest.
Minnesota loses residents to other states
Given these two facts — that taxes affect where people locate and that Minnesota has some of the highest taxes in the United States — we should not be surprised that more residents are deciding to leave the state and residents of other states are declining to move here.
Movement of people
Data from both the Census Bureau and the Internal Revenue Service tell us that the net domestic migration of people into Minnesota turned negative in 2002 and remained negative until 2017. That year and the following, our state actually gained residents on net from other states and some heralded this as a vindication of public policy here. In 2019, however, this inflow dried up as suddenly as it had come: Minnesota lost 965 residents on net according to the Census Bureau and in 2020 the net loss was 9,757, the third largest net loss of residents to other states in thirty years.
Comparing the three decades of the 1990s, 2000s, and 2010s, Minnesota experienced a net gain of 86,847 people in the 1990s, but net losses of 43,962 in the 2000s and 27,569 in the 2010s, according to the Census Bureau. Positive net migration from abroad means that Minnesota still generally sees positive net migration figures overall. But, once in Minnesota, these people can then join the net domestic outflow of migrants.
Net domestic migration is the number of people moving to the state from elsewhere in the United States minus the number of people moving from it to other states. Data suggests that Minnesota’s net losses are driven largely by people declining to move here. Both the inflow and outflow reported by the IRS consistently increased through the 1990s. However, in the 2000s the outflow of people leaving Minnesota plateaued while the inflow of people dropped. Thus, the decline in the net number of people moving to Minnesota is primarily due to fewer people moving into Minnesota.
Movement of income
As Minnesota has lost residents to other states, it has also lost income to other states.
Strictly speaking, income does not move; people do. An individual’s income may be higher or lower after moving to a new state. Nevertheless, saying that income is “moving” is useful shorthand for saying that the earning power of those households is moving between states.
IRS numbers show that Minnesota began experiencing substantial annual losses in Adjusted Gross Income (AGI) in 1997 — five years before net domestic migration turned negative. This suggests that higher earners, on average, were at the forefront of this. Minnesota has lost income to other states in every year since then. Income losses to domestic migration held somewhat steady between 1996 and 2011, averaging $514.5 million annually in 2019 dollars. This loss then increased sharply up to 2014, peaking at over $1 billion, before declining up to 2017 and then rising sharply again in the last two years for which we have data.
Taxes influence migration
Looking at the data on the tax burdens in the states that Minnesota is gaining residents from and losing them to, we see that, as theory and the empirical literature suggest, these flows are being driven, in part, by our state’s high taxes.
Over the last ten years for which we have IRS data (2009-2010 to 2018- 2019), the ten main sources of residents moving to Minnesota were Kansas, Indiana, Ohio, Michigan, Nebraska, Wisconsin, New York, North Dakota, Iowa, and Illinois. The ten leading destinations for Minnesota residents were California, South Carolina, Oregon, Georgia, North Carolina, Washington, Colorado, Texas, Arizona, and Florida.
Of course, Illinois (population 12.7 million in 2019) has more people to send to other states than Iowa (population 3.1 million in 2019). To account for this, we can look at the ratio of Minnesota’s in- migrants from a particular state to its out- migrants to it. A ratio above 1.0 means that Minnesota gained residents from that state, a ratio below 1.0 means we lost residents to it.
It is striking that five of the seven jurisdictions with tax burdens higher than ours – New Jersey, New York, Vermont, Rhode Island, and Maine – were among the top ten sources of domestic migrants to our state over the period 2009-2010 to 2018-2019, as measured by the ratio of residents moving in to residents moving out. Indeed, a broad look shows that the average tax burden over this period of the top ten sources of migrants to Minnesota was 9.6 percent (the median was 10.0 percent) while the average tax burden of the top ten destinations of domestic migrants from Minnesota was 8.1 percent (the median was 8.2 percent).
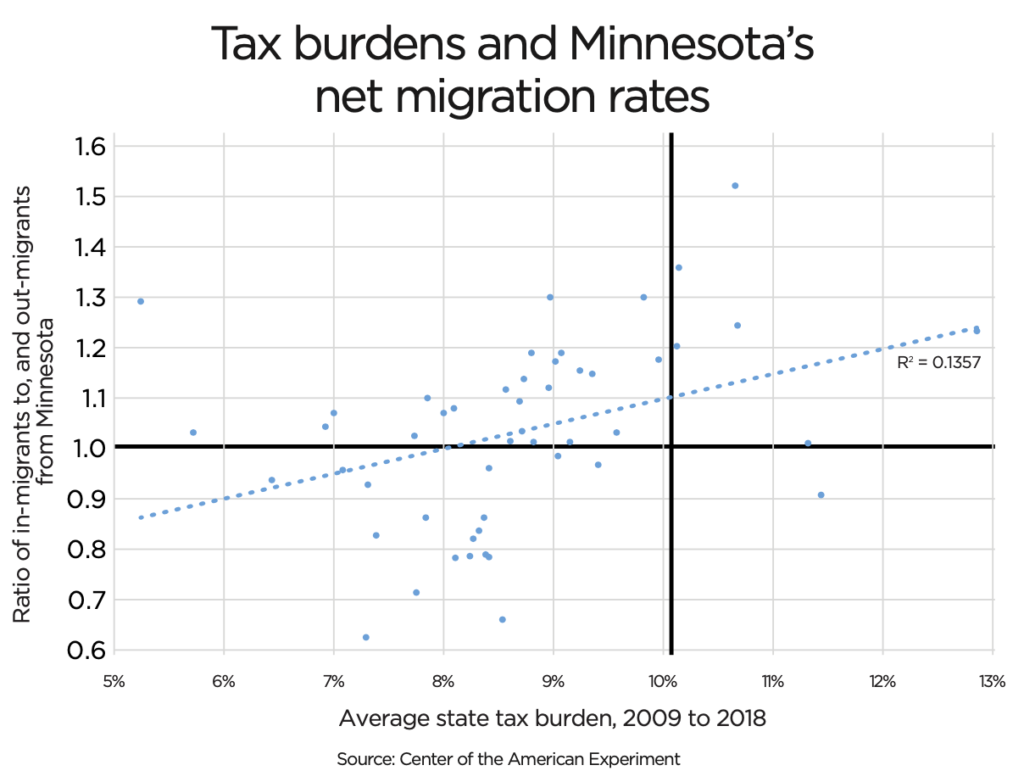
The accompanying chart shows the relationship between average tax burdens in other states over the period 2009 to 2018 and the ratio of domestic in-migrants to out-migrants over the period 2009-2010 to 2018-2019. We see a positive relationship between the tax burden in a state and the ratio of in-migrants to out-migrants from that state to Minnesota: in other words, the higher the other state’s tax burden the greater, on average, the ratio of in-migrants to out-migrants, and the lower the other state’s tax rate the lower the ratio of in- migrants to out-migrants. Put more simply, the lower (higher) the tax burden in the other state the greater our migration loss to (gain from) it.
Why this matters
Minnesota’s loss of domestic migrants poses a two-pronged problem for the state. One is that it will lead to lower rates of per capita economic growth in the future. Another is that it will place increased pressure on state government budgets.
Per capita economic growth is what matters for material well-being; it derives from increases in productivity per worker, not more workers per se. So a loss of residents need not indicate a decline in per capita GDP and living standards. It all depends on how productive those leaving are. If a worker who is more productive than the average of workers residing in a state leaves that state, that worker will decrease GDP (the numerator in the equation GDP / population = per capita income) by a greater increment than they decrease the population (the denominator) which leads to lower GDP per capita.
Sadly, IRS data show that tax filers leaving Minnesota have consistently had higher incomes than those moving to our state. In 2018-2019, the average AGI per return of Minnesota’s in- migrants was $66,322, for those leaving our state it was $80,684.
From 2011-2012, the IRS has broken down migration data by income of the primary taxpayer and this allows us to see the net flows of domestic migrants into and out of Minnesota by income group. These numbers tell us that our state has seen net inflows of domestic migrants in every income category below $50,000 annually but net outflows at every income level above that. If we make the standard economic assumption that income is driven by productivity, this means that Minnesota has experienced a net loss among its most economically productive residents. This makes no judgment on those in or out migrants except to say that, from the standpoint of per capita economic growth, Minnesota has been losing and/ or failing to attract residents who would add relatively more to the numerator of our per capita income equation and gaining those who would add relatively more to the denominator. The result will be lower per capita incomes.
“The rich” pay a disproportionate tax
A second reason to worry about the net outflow of higher earners from Minnesota is that state tax revenues come disproportionately from “the rich.”
IRS Data also allow us to see the net flows of AGI into and out of Minnesota by income of the primary taxpayer for the period from 2011-2012 to 2018-2019. This tells us that the net 5,838 people with AGI of $1 to $10,000 annually who moved to Minnesota over this period shown in Figure 13 brought a net gain in AGI of $11.9 million (an average of $2,039 per return). Meanwhile, the 18,466 Minnesotans on net with incomes of upwards of $200,000 who left over this period took with them $3.8 billion of AGI ($207,553 per return). A total of $5.5 billion of AGI left the state between 2011-2012 and 2018-2019, driven by the loss of higher-earning Minnesotans.
The Minnesota Department of Revenue’s Tax Incidence Studies show why this could lead to problems for state finances. They break down the share of all income earned in the state and the share of total tax revenue paid by each population decile by household income. In 2018 the bottom 30 percent of Minnesota households by income (who earned 5.8 percent of all income earned in the state) paid no individual income tax: indeed, after tax credits, they were negative contributors to state income tax revenues with an effective state income tax rate of -0.2 percent. By contrast, the top ten percent of Minnesota households by income earned 43.0 percent of all the income earned in the state but paid 59.4 percent of total income tax revenues for an effective state income tax rate of 6.4 percent. For the top 1 percent, the disparity is even greater: they earned 16.5 percent of all income earned in the state but paid 27.1 percent of all income tax revenues for an effective state income tax rate of 7.7 percent. To put it another way, the 27,882 households in the top ten percent of Minnesota households by income paid more state income tax than the 2,230,008 households in the bottom 80 percent of Minnesota households by income. These shares of income earned and tax paid are strikingly stable over time and are little affected by changes in top tax rates.
This is not to elicit sympathy for “the rich,” but it should highlight how state policymakers cannot afford to wish away the evidence of “tax flight” when formulating fiscal policy.