To lockdown, or not to lockdown?
Counting the economic costs of government policy responses to COVID-19.
In March 2020, COVID-19 hit Minnesota. State and local governments enacted a number of measures — so-called “non-pharmaceutical interventions” (NPIs) — intended to slow the spread of the virus and save lives. The most prevalent and widespread measures enacted by state and local governments were so-called “lockdowns” of individuals and shutdowns of certain “non-essential” businesses. These specific tactics were covered in the spring 2021 issue of Thinking Minnesota in the article, “Covid Confusion.”
The government-imposed lockdowns and shuttering of businesses imposed a heavy economic cost on the state. Minnesota’s Gross Domestic Product (GDP) fell by 9.7 percent in real terms from the fourth quarter of 2019 to the second quarter of 2020. In the seven days from March 16 to March 22, 2020, 126,603 Minnesotans filed for unemployment insurance and the unemployment rate jumped from 3.9 percent in February to 10.8 percent in May. This was the most severe shock our state’s economy has suffered on record. After more than two years, economies across the United States are still recovering.
Costs versus benefits
Were these measures worthwhile? This is an important question to ask — and part of a more essential and substantive evaluation of how policymakers and public health officials shape their responses to events that can have far-reaching consequences economically but also for society at-large.
Public policy must be judged by its costs, as well as its benefits. While there was much discussion of the supposed benefits of NPIs in terms of lives saved, there was — and has been — much less discussion of their costs. Indeed, at the time any acknowledgment that such costs even existed was likely to invite a charge of “COVID denialism.”
As the latest Thinking Minnesota Poll shows, trust in institutions — specifically public health — is dramatically low among Minnesotans. For trust in institutions to return, especially regarding public health, it is important to evaluate the judgment and policies put in place during public health emergencies such as during the COVID-19 outbreak. For those in the public sphere, they need to consider a more nuanced, balanced approach to the benefits as well as the costs to the economy rather than making sweeping assumptions or targeted attacks.
As these evaluations are made, the evidence continues to accumulate that these measures did have costs — and very significant ones. From higher crime to lower educational outcomes, the consequences of shutting down the state — and the country — to combat this virus persist, and will for years to come.
To weigh the costs of these measures against their benefits we need to quantify those costs and benefits. Quantifying the economic costs of government policy responses to COVID-19 is the subject of American Experiment’s new report, “The Costs of Lockdowns and Shutdowns: Counting the economic costs of government policy responses to COVID-19.”
Quantifying government responses
One of the advantages of America’s federalist system of government is that individual states have autonomy in implementing certain laws and policies. Each state is mostly free to enact laws and regulations best suited for the people of that state. This system was a good way to observe different policies — and their consequences — during the COVID pandemic. Did these differences in policy response account for differences in the observed economic outcomes? If so, how much of these differences were they responsible for?
To answer these questions, we focus our analysis on GDP, a standard measure of a state’s economic health, specifically the percentage change in real GDP from quarter to quarter for the five quarters 2020:Q1, 2020:Q2, 2020:Q3, 2020:Q4, and 2021:Q1. This is the response (or outcome) variable. Did government policy responses to COVID-19 influence the growth rates observed?
To assess the impact of government policy responses on real GDP growth we need some way of quantifying those government policy responses. Fortunately, the Blavatnik School of Government at Oxford University produced a “Coronavirus Government Response Tracker,” which gave the 50 states and District of Columbia a daily index number up to April 28, 2021, quantifying the stringency of their policy response to COVID-19. We use the average daily stringency score over the quarter as one of our explanatory (or factor) variables.
Of course, government anti-COVID-19 policies were not the only influences working on state economies over this period; the virus itself was something of a moving target as seasons changed and mutations occurred. We can hypothesize that, to some extent, people reacted to it by staying home even without the government telling them to. This will have imposed some economic cost independent of any actions taken by government.
The virus needs to be quantified to test this — but how? There are three possible measures: cases, hospitalizations, and deaths, all adjusted for population. However, there are drawbacks to using cases as a measure as there were many asymptomatic cases of COVID-19, meaning people were unaware they had been infected. The only data we have for cases, then, is for diagnosed cases, which is not the same thing, and could be a function of a more extensive testing regime rather than of an increased prevalence of the virus. Nevertheless, newly diagnosed cases were the numbers generally reported. So, to the extent that people reacted to this news, it seems reasonable to use the average daily number of new cases in a quarter taken from the Centers for Disease Control and Prevention as another explanatory variable.
Fiscal policies also differ across states and this, too, could account for some of the differences in the observed economic outcomes. The Tax Foundation’s “State Business Tax Climate Index” awards each jurisdiction a score. These scores for 2020 and 2021 can be used as a third explanatory variable.
It is also true that, at both the national and local level, the economic impacts of COVID-19 were much heavier in two sectors of the economy more than in the others: arts, entertainment, and recreation; and accommodation and food services. Nationally, the decline in arts, entertainment, and recreation GDP from the fourth quarter of 2019 to the second quarter of 2020 was 58.8 percent, more than double the decline in the third most heavily impacted sector nationally — which was transportation and warehousing at 24.7 percent. The second worst hit sector nationally in that period, accommodation and food services, saw a decline of 48.0 percent, nearly double the decline than that of transportation and warehousing. It seems reasonable to assume, then, that jurisdictions with higher shares of their overall GDP in these sectors going into the pandemic would have been more heavily impacted. Indeed, while the share of United States GDP derived from arts, entertainment, recreation, accommodation, and food services was 3.9 percent in 2019, for Hawaii it was 11.1 percent, and for Nevada it was 15.2 percent. These were the two worst hit states in terms of GDP between the fourth quarter of 2019 and the first quarter of 2022. So, another explanatory variable will be the share of the jurisdiction’s economy accounted for by the arts, entertainment, recreation, accommodation, and food services sectors in 2019.
The results
With our response variable — the percentage change in real GDP from quarter to quarter — and our explanatory variables — the average daily stringency score, average daily number of new cases, tax burden, and share of the jurisdiction’s economy accounted for by the arts, entertainment, recreation, accommodation, and food services sector in 2019 — we can run a multiple panel regression measuring the impact of our chosen explanatory variables on the growth rate of real GDP.
Taken from a technical standpoint, a few key statistics summarize the findings. Our Prob(F-statistic) is less than 0.05, which indicates that our explanatory variables combined have a statistically significant association with real GDP growth rates. The individual p-values tell us whether each explanatory variable is significant. They show us that, while the stringency of government policy responses has a statistically significant relationship with growth rates of real GDP (p < 0.05), none of the other explanatory variables do (p > 0.05). The Adjusted R Square value of 0.877 indicates that 87.7 percent of the variation in real GDP growth rates can be explained by differences in our explanatory variables, daily new cases, tax burden, and portion of the state’s GDP coming from arts and entertainment. The Coefficients of each explanatory variable tell us the average expected change in the growth rate of real GDP, assuming the other explanatory variables remain constant. For each point increase in the stringency index, the growth rate of real GDP is expected to decrease by 0.05 percentage points.
This coefficient enables us to make a quantitative estimate of the impact of stringency — government policy responses to COVID-19 — on real GDP growth. First, we calculate the effect of stringency then subtract the stringency effect from the observed change in real GDP to estimate what that would have been without these policy responses.
This can be repeated for each jurisdiction in each quarter to come up with estimated real GDP growth rates without government COVID-19 responses. Those rates can then be applied for the five quarters 2020:Q1, 2020:Q2, 2020:Q3, 2020:Q4, and 2021:Q1 to the level of GDP in Q4:2019 to estimate what per capita GDP would have been without government policy responses to COVID-19.
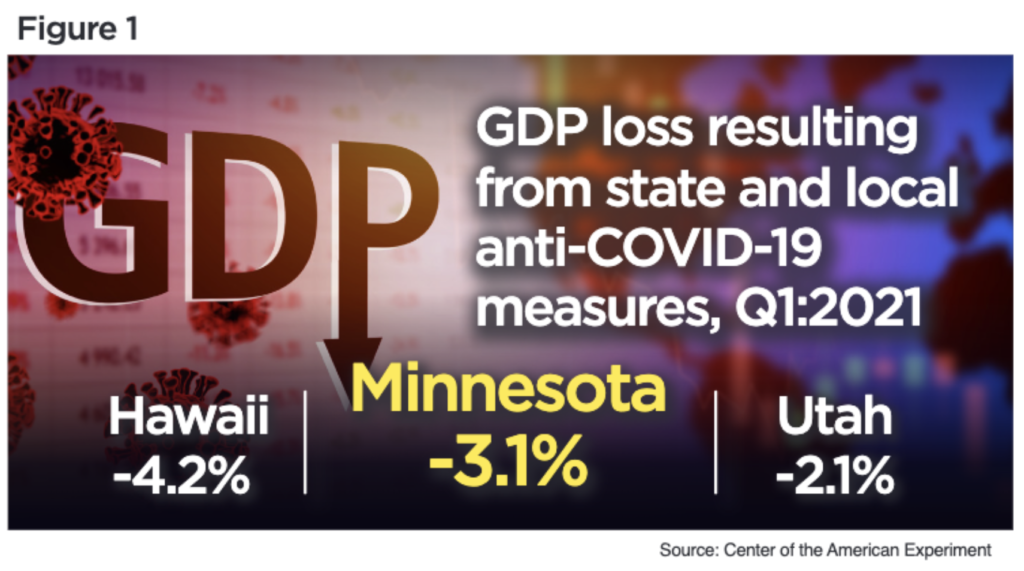
Figure 1 shows the difference between actual GDP in the first quarter of 2021 and the estimate of GDP in that quarter without government policy responses to COVID-19. Hawaii suffered the greatest loss resulting from its government’s policy responses — responses that included statewide limits on social gatherings, bars, and restaurants, statewide mask mandates and proof of vaccination, as well as strict traveling restrictions into the state — with GDP lower by 4.2 percent ($3.1 billion) in the first quarter of 2021 than it would have been without these responses. At the other end of the scale is Utah, whose government policy responses to COVID-19 imposed an economic cost of 2.1 percent of GDP ($3.9 billion). Utah lifted its mask mandate and social gathering restrictions by early spring in 2021. Minnesota’s GDP in the first quarter of 2021 was 3.1 percent ($10.6 billion) lower as a result of the government’s policy response to COVID-19 — measures that included an extended peacetime state of emergency and city or county mask mandates and limits on social gatherings — ranking it 25th in the nation.
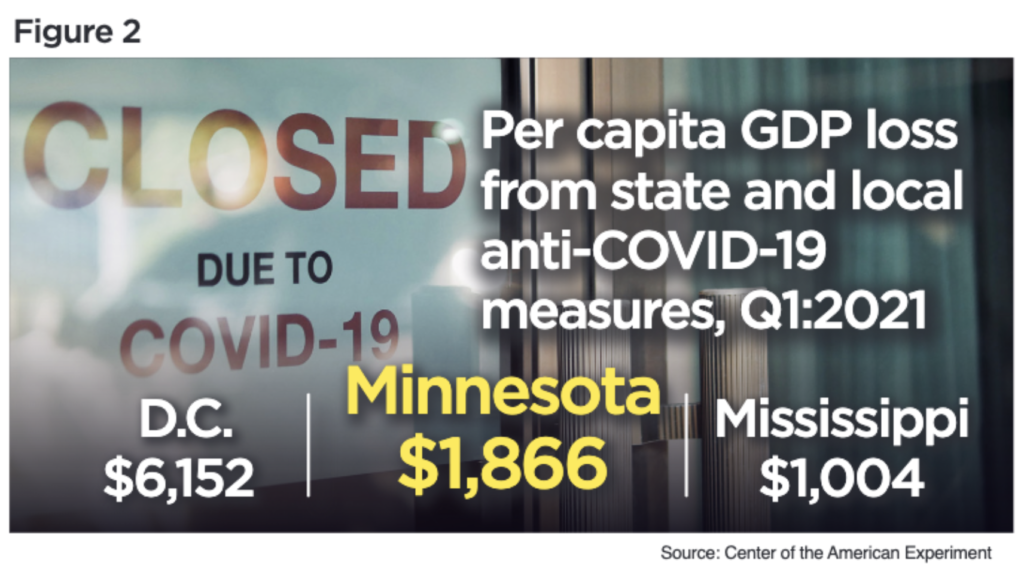
Figure 2 puts this into some perspective, dividing these dollar losses by the population to derive a per capita loss. Here, the District of Columbia was by far the worst hit jurisdiction with a per capita GDP loss of $6,152 by the first quarter of 2021 resulting from its government’s COVID-19 policy response. This should be qualified, however, by noting that it is one of the easier jurisdictions to move out of while still working and producing GDP there. Its population decline — 2.5 percent from 2019 to 2021 — was the steepest among the 51 jurisdictions, indicating that a fall in the denominator (population)played a more significant role in the result of this equation than elsewhere. At the other end of the scale is Mississippi, whose government’s COVID-19 policy responses imposed costs of “only” $1,004 per person by the first quarter of 2021. Minnesota’s government policy responses to COVID-19 cost each resident $1,866 in lost GDP by the end of the first quarter of 2021, or $7,464 for a family of four: This was the 15th biggest hit in the United States.
Moving forward
These estimates do not say whether the public policy responses to the COVID pandemic were justified, but quantifying the economic costs of the unprecedented peacetime impositions on economic life by state and local governments in response to COVID-19 are crucial to their evaluation. Benefits and costs must be weighed to make that judgment. The analysis made through quantifying the economic costs are a solid first step in evaluating the overall appropriateness of the government’s policy responses. The question, then, is what were the medical benefits of these policy responses, most notably the lockdowns and shutdowns that had the most impact on the economy?
When such estimates are offered, we now have two policy priorities discordant with each other: economic health or public health. We can now begin to answer the question of whether the cost of these policy responses — $7,464 for a Minnesota family of four over the first year of the pandemic — were worth the benefits. And Minnesota has a quantitative tool and a historical example to make better, more informed decisions should a similar situation occur in the future.