Transportation: Moving People and Commerce Where They Want and Need to Go
Updated November 20, 2014
To read this chapter as it appeared in the 2014 book, click here.
EXECUTIVE SUMMARY
The Problem
Minnesota can and must support and build a world class transportation system that provides a foundation for economic prosperity and personal fulfillment for all Minnesotans. Doing so is mostly a matter of making transportation a higher priority.
Transportation should embrace the philosophy that Minnesotans and Minnesota employers know where they want to go and how they want to get there. Instead of trying to impose other policy objectives on our transportation dollars, such as encouraging people to drive less, transportation policy should focus on supporting this demand as efficiently and cost-effectively as possible.
The Minnesota Department of Transportation (MnDOT) projects a five to twelve billion dollar funding gap for Minnesota’s main roads and highways. These are the very highways that move people and freight—the raw materials and goods that make the economy run. Minnesota workers and freight are fighting ever increasing amounts of congestion, losing time and money sitting in traffic and doing so on even poorer quality roads. While our roads and mobility deteriorate, policy makers have taken their eye off the road and steered more and more scarce public dollars to an expensive and slow light rail system that moves too few people and no freight.
Lack of funding is the main reason for increased congestion and declining pavement and bridge conditions. The main source of federal funding for highways, the Federal Highway Trust Fund, is declining. This could force the Federal Department of Transportation to begin delaying payments to states. Minnesota’s fuel- and vehicle- related tax revenue streams face similar challenges due to increasing fuel efficiency, people driving less and slower new vehicle sales.
The Solution
Addressing questions of transportation funding, as well as proper maintenance and expansion will require a significant shift in public policy priorities. Reducing congestion and re-aligning priorities toward mobility and commerce reinforces the essential role of the state’s transportation system—moving people and commerce where they want and need to go. Moving forward, Minnesota must pursue options that result in a greater return on investment, promote statewide economic development and prioritize spending in order to live and thrive within its means. The following recommendations restore roads as a top priority and return the state’s transportation system to one that promotes economic prosperity for all Minnesotans.
Focus transit spending on cost effective approaches to connect people to jobs
- Place a moratorium on future light rail projects, focus resources on road expansion and repair, and divert constitutionally mandated and other transit dollars to more cost effective modes of transit.
- Focus new transit spending on more flexible and less costly transit options, such as bus rapid transit.
Invest the funding necessary to maintain and improve Minnesota’s transportation system
- Dedicate a portion of the existing statewide sales and use tax proceeds to road and bridge maintenance and expansion.
- Direct the Legislative Auditor to review the Transportation Finance Advisory Committee 20-year transportation funding and financing projections.
- Set aside a larger portion of state bonding for maintenance and congestion relief projects for local roads and bridges.
- Convert the Counties Transit Improvement Board to the Counties Transportation Improvement Board.
- Revise Minnesota law to enable implementation of a public-private partnership (3P) pilot program and determine which state transportation projects and programs could be more efficiently and affordably delivered using the 3P model.
Reduce traffic congestion for commuters and commerce
8. Set a goal to reduce the miles of congested roadway in the Twin Cities by 20 percent in 10 years.
9. Require MnDOT to create a congestion relief action plan to meet the goal. Enhance the existing freight network across Minnesota
10. Update the boundaries of the Minnesota Department of Transportation’s regional districts and empower those districts to select project and funding priorities on regional road and bridge projects essential to statewide economic development.
THE PROBLEM
Efficient road traffic fuels Minnesota’s economic engine and is essential to job creation and improving the quality of life for all Minnesotans. Trucks carry the majority of the freight traveling to and from Minnesota destinations—66 percent of total tonnage (386 million tons) and 60 percent of total value ($297 billion).1 Safe, efficient movement of freight is critical for Minnesota’s manufacturers, retailers, wholesalers, and farmers. Together, these businesses account for 32 percent of Minnesota workers.2 Of course, Minnesotans also need to get to work and they primarily depend on roads, too. Over 87 percent of workers in the Twin Cities commute to work by car, and nearly everyone else gets to work on roads by way of a transit bus.3
Despite enthusiasm surrounding trains and other transportation alternatives, the reality is Minnesota’s businesses and workers use roads and bridges to make the economy run. Minnesota’s road system, however, is facing challenges.
Congestion is the most visible challenge facing Minnesota drivers. The Minnesota Department of Transportation (MnDOT) measures congestion based on the number of freeway miles with traffic moving less than 45 miles per hour. Congestion is assessed in October to help avoid non-reoccurring causes of congestion, like construction and weather-related delays. As shown in Figure 1, total morning and evening congestion in the Twin Cities grew from 174 miles in 1995 to 326 miles in 2010 and appears to have leveled off after 2010. However, more severe congestion lasting more than 2 hours continues to grow and reached nearly 100 miles of highway in 2013, which represents around one-third of congested miles.
Data from the Texas A&M Transportation Institute offers a more positive view on recent congestion trends. These data assess year round traffic on both freeways and streets. Figure 2 shows congested travel in the Twin Cities, both as a percentage of the road system and as a percentage of peak period vehicle miles traveled, plateaued between 2000 and 2005 and then dropped after 2005. Figure 2 also shows this drop in congestion occurred at the same time lane miles were added, which strongly suggests adding lane miles reduced congestion.4 However, these benefits are now built into the system and congestion is again on the rise.
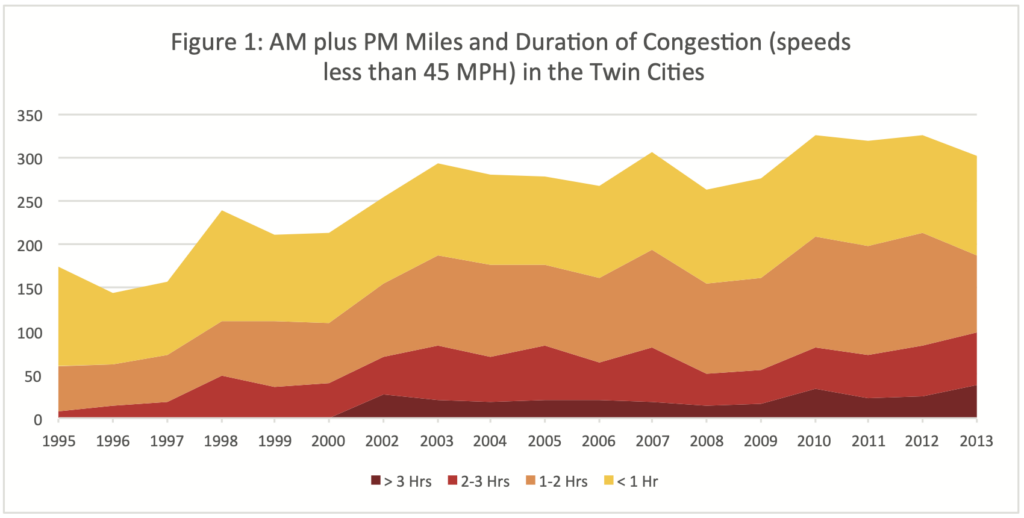
Source: Minnesota Department of Transportation, Metropolitan Freeway System Congestion Report, various years.
Congestion issues are not limited to the Twin Cities. In 2009, the Minnesota Statewide Transportation Policy Plan reported: “Traffic volumes on interregional corridors have risen by 50 percent in the last 10 years causing congestion and safety concerns especially near large regional trade centers.”5 In particular, mobility along interregional corridors in central Minnesota is expected to decline.
Not only is congestion increasing, it is happening on even poorer quality roads. In 2002, 310 miles (2 percent) of state highway were in poor condition.6 By 2011, the miles of poor roads rose to 940 (7 percent) and MnDOT expects the mileage to rise to 1,300 (9 percent) by 2016. In the National Highway System, the pavement condition of Minnesota’s rural highways ranks 43rd.7 The pavement condition of Minnesota’s urban highways ranks much higher at 16th. However, comparing only urban interstates, the state ranks 41st.8 Poor pavement conditions, according to MnDOT, “result in slower traffic times, higher vehicle operating costs, additional safety hazards, and reduced economic development.”9
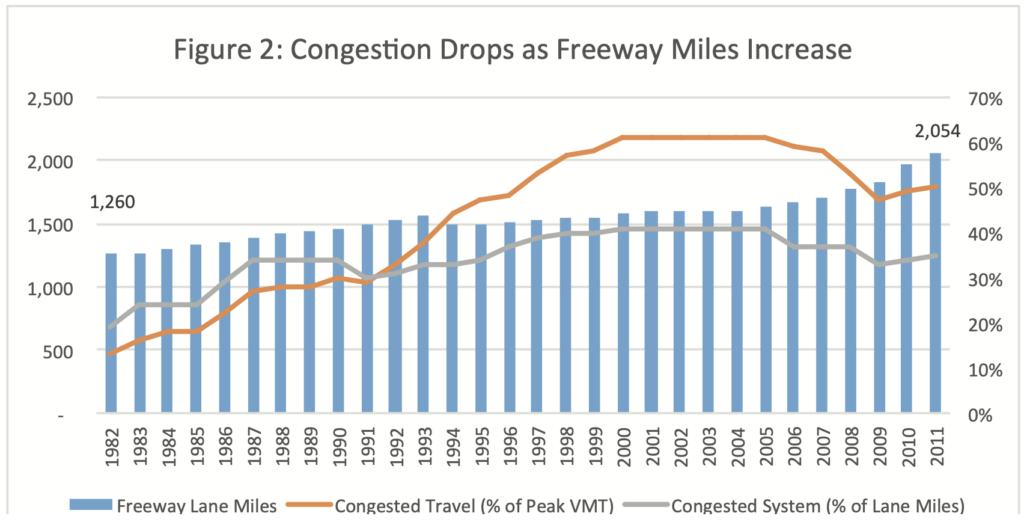
Source: Texas A&M Transportation Institute, 2012 Annual Urban Mobility Report, Congestion Data for Your City spreadsheet (December 2012), available at http://mobility.tamu.edu/ums/.
Bridge conditions in Minnesota have improved but are aging. Currently, 87 percent of bridges are in Good or Satisfactory condition, 11 percent Fair and 2 percent Poor but it took a major catastrophe, the collapse of the 35W Bridge and the death of 13 people to provide the political willpower to devote the attention and resources necessary to adequately address the problem.10 The infusion of federal and state dollars to focus attention on bridge repair has made a very significant and positive impact. MnDOT’s project funding will remain sufficient to meet structural goals for the next 10 years. But, Minnesota bridges are aging and they are doing so at a steady rate. Currently, 2,900 Minnesota bridges are older than 50 years but by 2030, that number could more than double to over 7,200.11
Safety is always a top priority and here Minnesota excels. After establishing the Toward Zero Deaths Program in 2003, Minnesota experienced the third largest drop in the fatality rate in the country, dropping from 1.19 deaths per million miles traveled in 2003 to .69 deaths in 2012, moving Minnesota to the second lowest fatality rate in the nation.12 Minnesota reports that serious injuries also declined dramatically after 2003.13 Minnesota is clearly on the right track, therefore, there are no specific recommendations here other than to say the state should not let up on its commitment to make roads even safer.
Finally, many Minnesotans depend on transit (buses mostly) to get to jobs and other destinations. Unfortunately, today’s transit system is not well suited to connect people to jobs. Though 67 percent of working-age Twin Cities residents live near a transit stop, only 30 percent of jobs are reachable via transit in 90 minutes or less, according to the Brookings Institute.14 The percentage of jobs reachable via transit drops to 7 percent for people who want to reach their jobs in less than 45 minutes.15
HOW WE GOT HERE
Lack of funding is the main reason for increased congestion and declining pavement and bridge conditions. The main source of federal funding for highways, the Federal Highway Trust Fund, is declining. This could force the Federal Department of Transportation to begin delaying payments to states as early as this fall.16
Minnesota’s revenue stream faces similar challenges. As shown in Figure 3, the state’s primary state transportation revenue sources remained flat between 2000 and 2008, which, when accounting for inflation, represents a decline in revenues. During that period, bonding was used to help compensate for this decline in revenue. Revenues began ticking up in 2009 when the motor fuels and motor vehicle registration tax increases passed in 2008 began to phase in.
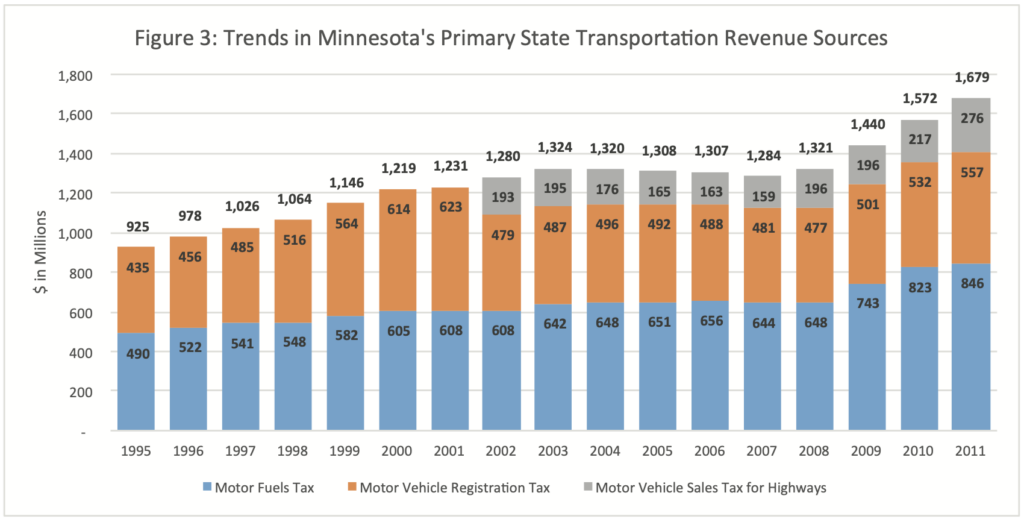
Source: Minnesota Department of Transportation, 20-Year Minnesota State Highway Investment Plan 2014-2023, Appendix E. Revenue Forecast (December 2013), available at http://www.dot.state.mn.us/planning/mnship/pdf/finalplan/revenue-forecast.pdf.
Looking forward, MnDOT’s project funding from the State Highway Trunk Fund will increase by only 2 percent per year for the next 20 years, which is much slower revenue growth than in previous decades.17 Growth is expected to slow due to increasing fuel efficiency, people driving less and slower new vehicle sales. Compounding the revenue growth issues, construction costs are projected to increase at an annual rate of 5 percent. Thus, future tax dollars will buy fewer construction projects in coming years.
Combine slow revenue growth with rising construction costs and, according to the Minnesota Transportation Finance Advisory Committee, the state’s highway system alone faces a $5 billion gap ($250 million annually) in funding over the next 20 years to just maintain the existing system and a $12 billion gap ($600 million annually) if the state wants to expand the transportation system to become more economically competitive.18 Addressing these funding issues has not been a high enough priority in recent years. Minnesota is collecting plenty of tax revenue. Taxes were increased by $2.1 billion in 2013, but none of that went to transportation. Bonding in 2014 went to other misplaced priorities as well, such as $80 million for housing infrastructure bonds. Or consider the $90 million going toward the new Senate office building and parking ramp. That money could have reconstructed 40 miles of principal arterials in Southwestern Minnesota or relieved a choke point along MN 23 near Paynesville.
In their most recent performance report, MnDOT clearly admits congestion relief is no longer a priority.
Going forward, MnDOT expects congestion to remain the same or increase as the region continues to grow. Since 2010, MnDOT’s strategy has shifted away from reducing congestion and toward providing alternatives to congested travel.
Based on the Minnesota State Highway Investment Plan, MnDOT plans to direct nearly 70 percent of transportation investments over the next ten years toward maintaining the current infrastructure of roads and bridges.19 Congestion relief in the Twin Cities gets just 7 percent ($520 million), while congestion relief in greater Minnesota gets nothing. As a result, “the number and scope of system capacity improvements decrease.” Bicycle infrastructure, however, receives $100 million. In years 11 through 20, the plan directs nearly 90 percent of funding to maintain current infrastructure and nothing toward congestion relief. Bikes continue to receive $100 million.
Priorities have also been misplaced on transit. The Met Council and many DFL lawmakers remain stubbornly committed to rail transit, despite the fact that rail transit is extraordinarily expensive, time consuming to ride, and set on a fixed track that cannot flexibly connect people to jobs. Instead of connecting transit to where people live and work, the Met Council appears focused on steering people into higher density housing along light rail corridors. The $1.7 billion price tag for the Southwest LRT would be better spent on improving the bus system. This would more effectively connect people to jobs and other important destinations. And by the way, $1.7 billion is three times more than what MnDOT plans to spend on congestion relief over the next 10 years.
CONSEQUENCES
Allowing congestion to grow and failing to maintain good road conditions will undermine Minnesota’s future competitiveness. The Texas A&M Transportation Institute determined that every American wasted an average of $818 sitting in traffic in 2011.20 That same study found Americans spent an additional 5.5 billion hours on the road for a total cost of $121 billion, with $27 billion of that in wasted time and fuel for commercial truck drivers alone.21 The Twin Cities ranks 19th for total congestion cost at $1.26 billion and 24th for commercial truck costs at $232 million.22
The State of Washington recently assessed the potential economic impact if its truck freight encountered a 20 percent increase in traffic congestion. While some jobs would be gained due to the need to hire more drivers to combat congestion, far more jobs are “lost due to lessening demand from consumers, who must devote more resources to purchasing goods, and are therefore required to cut back in other spending categories.” 23 They determined that when all of the direct, indirect, and induced impacts are accounted for, Washington State would experience a net loss of nearly 30,000 jobs and $3.3 billion in economic output. Assuming Minnesota experienced proportional losses based on the size of its economy—about three quarters the size of Washington—Minnesota would lose about 23,000 jobs and $2.5 billion in economic output.24
RECOMMENDATIONS
Rather than waiting for the next tragedy and watching Minnesota’s opportunities for economic growth and prosperity travel to neighboring states or countries, it is time for Minnesota’s decision makers to transcend traditional political tethers, work together and pursue genuine solutions that address the very real problems Minnesota faces today. Moving forward, Minnesota must pursue options that result in a greater return on investment, promotes statewide economic development and prioritizes spending in order to live and thrive within its means.
Focus transit spending on cost effective approaches to connect people to jobs
Recommendation 1: Place a moratorium on future light rail projects, focus resources on road expansion and repair, and divert constitutionally mandated and other transit dollars to more cost effective modes of transit.
In 2006, a Constitutional amendment passed dedicating at least 40 percent of the revenue from a tax on new and used motor vehicle sales to public transit assistance and not more than 60 percent for highway purposes. What that amendment did not do is mandate a disproportionate amount of transit resources to be spent on a light rail system. The development of light rail is coming with a very expensive price tag but without sufficiently proven results. Each of the three major light rail projects (Green Line, Blue Line, Metro Green Line) completed or in progress, costs significantly more per mile than road expansion or other transit options such as Bus Rapid Transit (BRT.) If light rail ridership reflected a significant change in how Minnesotans traveled, perhaps such a heavy investment in this one option would be justified. Without sufficient evidence to demonstrate a shift, Minnesota’s limited transportation resources should be directed to those places where the state will experience a greater return on its investments.
A moratorium on new light rail projects will provide time for more evidence regarding light rail’s impact to be gathered and assessed. Is ridership increasing in numbers that justify such a significant investment of public dollars? Is Minnesota’s economy growing and are quality jobs being created as a result of this transit option? With such significant and scarce public resources at stake, and with claims from many parties declaring light rail as the answer to Minnesota’s transportation woes and just as many claims declaring it a bottomless pit of wasted public dollars, it is time to hit pause. By allowing evidence to develop, Minnesota will be in a better position to make informed decisions regarding current transit and future transportation needs and how to best address the growing congestion and road quality concerns the state currently faces.
Recommendation 2: Focus new transit spending on more flexible and less costly transit options, such as bus rapid transit.
At a length of 11 miles, the Metro Green Line’s $957 million price tag equates to approximately $87 million per mile. By comparison, the proposed I-35W South BRT line or “Metro Orange Line” is projected to cost $208 million, which comes to $13 million per mile.25 The initial investment required to plan and build a new light rail line is only one aspect of total light rail costs. The $957 million cost to plan and build the new metro Green Line does not include the on-going annual operating costs.26 In 2019, the Metro Green Line’s net annual operating cost is projected to be $24.2 million, while operating costs for the Metro Orange line is approximately $4.6 million.27 Assuming the Metro Green Line carries 40,000 passengers per day and the Metro Orange Line carries 10,000, the operational costs are still about 30 percent more for LRT per rider. The comparison is striking. Not only does Minnesota pay significantly more per mile for light rail, the on-going costs to operate the system are also more expensive. These costs represent transit dollars that could potentially be invested in other transit options that cost less per mile.
Invest the funding necessary to maintain and improve Minnesota’s transportation system
Recommendation 3: Dedicate a portion of the existing statewide sales and use tax proceeds to fund road and bridge maintenance and expansion.
Providing for the state’s transportation infrastructure is an essential function of government and should be a priority reflected in the public policy decisions made by its leaders. The voting public seems to agree that the transportation infrastructure should be a higher priority for the state. 59 percent of voters in Minnesota believe that government has a duty to make sure that roads and bridges are safe and reliable and 51 percent believe it is THE top priority of government.28 With the state predicting that over the next 20 years it will be $5 billion short ($250 million annually) of funding for maintaining the current performance of the transportation system or $12 billion short ($600 million annually) of making economically competitive improvements and with the risk of less federal funding, a new source of transportation funding is warranted. As a first step, the state should dedicate .25 percentage points (a quarter cent of the tax on each dollar spent) of the existing statewide sales and use tax toward road and bridge maintenance and expansion. That would shift about $182 million of the $5 billion currently generated by the sales and use tax to transportation, which would go a long way to cover the $250 million annual shortfall.29 To be clear, this is not a recommendation to increase taxes. It is a recommendation to dedicate existing tax collections toward transportation, which may require spending cuts elsewhere, depending on revenue collections. Dedicating this funding elevates the priority of transportation funding in the state budget, a priority most Minnesotans demand. The additional revenue would also allow for additional bonding. Currently, annual debt service is nearing MnDOT’s limit set at 20 percent of annual state revenues to the trunk highway fund. Importantly, the funding source will not be undercut by increasing fuel efficiency and declining auto sales. The dedication should sunset after ten years in order to force the Legislature to revisit the issue.
Recommendation 4: Direct the Legislative Auditor to review the Transportation Finance Advisory Committee 20-year transportation funding and financing projections.
The previous recommendation relies on projections made by the Minnesota Transportation Finance Advisory Committee, which was supported by MnDOT. While these projections were no doubt made in good faith, it is entirely possible they have overestimated the funding requirements. Because the projections form the basis for substantial policy changes, they should be audited by the Legislative Auditor before making more dramatic policy changes to bridge the $12 billion gap identified in the report. The report should basically be an update to the Legislative Auditor’s 2008 evaluation of state highways and bridges.30
Recommendation 5: Set aside a larger portion of state bonding for maintenance and congestion relief projects for local roads and bridges.
At least every other year, Minnesota lawmakers enact a substantial bonding bill to fund hundreds of millions of dollars in capital improvements across the state. Transportation received $140 million in bonds in 2010, $50 million in 2012, and $100 million in 2014. After the Legislative Auditor reviews transportation funding requirements as recommended above and until a long-term solution is implemented to sustain adequate transportation funding, a larger portion of each bonding bill should be prioritized toward relieving congestion on Minnesota’s local roads and bridges. This is not to suggest bonding bills should be larger to accommodate more transportation bonding. Rather, congestion relief should be prioritized ahead of things like a Senate Office Building.
Recommendation 6: Convert the Counties Transit Improvement Board to the Counties Transportation Improvement Board.
As a result of legislation passed in 2008, seven metro counties were given the authority to increase the sales tax by 0.25-percent within the county and dedicate the proceeds to transit projects.31 While different forms of transit can help address traffic congestion by drawing riders to these other forms of transportation, nearly 90 percent of Minnesota workers and 66 percent of freight traffic depend on Minnesota roads. Transit projects alone will not alleviate the congestion issues these regions face. Converting the CTIB to the Counties Transportation Improvement Board (CTIB) and expanding its authority to fund road projects will provide another pathway for Minnesota to address congestion issues that hamper economic development. It will also give less dense areas outside the core cities more opportunities to use the funding. Currently, some counties, such as Dakota, are questioning whether they are receiving a fair share of the funding.32
In addition to expanding the function of the CTIB, the law addressing the ongoing operating costs of projects that receive funding through the CTIB should be strengthened. Currently, the law requires a grant applicant seeking transit capital funding to identify the source of money necessary to operate the transit improvement. This language should be clarified to require that those projects where the CTIB funds 20 percent or more of the capital costs, should also fund 100 percent of the on-going operating costs.
Recommendation 7: Revise Minnesota law to enable implementation of a public- private partnership (3P) pilot program and determine which state transportation projects and programs could be more efficiently and affordably delivered using the 3P model.
Minnesota has long “discussed,” “studied,” and debated the feasibility of utilizing public- private partnerships for various transportation projects. MnDOT previously identified projects at various stages of preparedness as potential 3P candidates, including projects that could be completed in the near term. They also convened a policy task force in 2011 to study the issue and recommend steps for moving forward. In a review of eight 3P projects, the Federal Transit Administration found they were completed between 1 and 6 years earlier than planned and saved between $1 million and $32 million.33 In Minnesota, various attempts have been made legislatively to move the approach forward but thus far a comprehensive initiative has not advanced to a state of implementation. There is little left to study and much more to be gained by moving forward with a pilot project.
Reduce traffic congestion for commuters and commerce
Recommendation 8: Set a goal to reduce the miles of congested roadway in the Twin Cities by 20 percent in 10 years.
The state should prioritize congestion relief by setting a congestion relief goal and focusing resources on these efforts. Similar to the zero death goal and approaches taken to reduce traffic fatalities, the state should set a congestion relief goal and focus resources to achieve a 20 percent reduction in traffic congestion in 10 years. Prioritizing and goal setting works. As already discussed, since setting the goal of achieving zero deaths on Minnesota’s roads, the state experienced the 3rd largest drop in fatality rate.34 With a clearly defined goal, MnDOT and other agencies were empowered to focus resources and work toward reducing fatality rates. MnDOT and Minnesota succeeded. Similarly, by drawing attention to reducing traffic congestion, MnDOT can again use its experience and know-how to improve Minnesota’s performance.
Recommendation 9: Require MnDOT to create a congestion relief action plan to meet the goal.
To reach the congestion relief goal, MnDOT will need to carefully craft an action plan. MnDOT already identifies high impact congestion relief projects in other planning documents. The action plan should prioritize these projects and clearly identify the return on investment expected from each project. Congestion is not just a Twin Cities problem and any plan must address issues in greater Minnesota.
Enhance the existing freight network across Minnesota
Recommendation 10: Update the boundaries of the Minnesota Department of Transportation’s regional districts and empower those districts to select project and funding priorities on regional road and bridge projects essential to statewide economic development.
The boundaries of the eight regional districts that manage the majority of day to day functions of MnDOT—including evaluating, recommending, and determining project and funding priorities within those specific regions—were originally based primarily on regional population centers. This may have served an important function at one time but the state’s $12 billion funding gap for its highway system demands updated priorities. Minnesota cannot afford to silo decisions regarding transportation infrastructure; making those decisions independent of overall economic development needs. The regional districts should be updated and defined according to major transportation routes vital to statewide economic development. The revised regional districts will then have at their center the major routes that move raw materials to manufacturers, goods and products to stores and then to homes. Reframing MnDOT and Minnesota’s transportation infrastructure through the lens of economic development will refocus limited resources on the main purpose of transportation infrastructure; moving people and goods where they want to go, when they want to get there, and doing so safely.
The already established Corridors of Commerce Program targets transportation routes essential to state and regional economic growth. Updating, not only the boundaries but also the priorities of MnDOT districts, to reflect the goals outlined by the Corridors of Commerce—a bonding program established to fund freight improvements and additional highway capacity—will help ensure already limited resources are directed to those projects that will have the greatest impact on statewide development needs. The newly drawn commerce-oriented districts should also then have greater discretion and authority to direct resources to economic corridors with the greatest needs. The local voices and partnerships that form the foundation of each current district’s decision- making capabilities are critical to statewide and regional decision-making. These local partners are essential and should also be updated to include regional voices of economic development.
Fritz Knaak, a former Minnesota State Senator, is an attorney at Holdstad and Knaak PLC. He is one of the country’s leading experts in election law, and he has over 30 years of experience as a city attorney and local government lawyer. Fritz also served as a Minnesota state senator. He received his B.A. from St. John’s University and his J.D. from the University of Minnesota.
Amy Roberts is Vice President and General Counsel at Connolly Kuhl Group. She has over fifteen years of experience working in public policy, having served as a Committee Administrator with the Minnesota House and later in director level positions for the de- partments of Education and Public Safety. She received her J.D. from Syracuse University and B.A. from the University of Minnesota.
ENDNOTES
1 Center for Transportation Analysis, Oak Ridge National Laboratory, Freight Analysis Framework Version 3.5 Summary Statistics (n.d.), at http://faf.ornl.gov/ fafweb/FUT.aspx. These data represent total domestic shipments within, from and to Minnesota destinations and exclude international shipments and shipments moving through the state.
2 U.S. Census Bureau, County Business Patterns (2012), available at https://www. census.gov/econ/cbp/.
3 U.S. Census Bureau, 2008-2012 American Community Survey 5-year Estimates, Table B08141, Minneapolis-St. Paul-Bloomington, MN-WI Metro Area.
4 Many of these additional miles—including lanes added to Interstate 494 and Highway 212—were funded by the Bond Accelerated Program, part of Gov. Tim Pawlenty’s 2003 transportation package.
Minnesota Department of Transportation, Bond Accelerated Program Final Report to Legislature on Trunk Highway Bonding (January 2008), available at http:// archive.leg.state.mn.us/docs/2008/mandated/080098.pdf.
5 Minnesota Department of Transportation, MN Statewide Transportation Policy Plan 2009-2028, Chapter 7 – Policy 5: Statewide Connections (August 2009), available at http://www.dot.state.mn.us/planning/stateplan/Final%20Plan%20Documents/ Policy%20Plan/Entire/Minnesota%20Statewide%20Transportation%20Policy%20 Plan_2009-2028.pdf.
6 Minnesota Department of Transportation, Minnesota State Highway Investment Plan: 2014-2033, Appendix F (December 2013), available at http://www.dot.state. mn.us/planning/mnship/.
7 Federal Highway Administration, U.S. Department of Transportation, Highway Statistics 2012, Table HM-47, available at http://www.fhwa.dot.gov/ policyinformation/statistics.cfm
8 Id.
9 Minnesota Department of Transportation, Assessing Return on Investment in Minnesota’s State Highway Program (November 2013), available at http://www.dot. state.mn.us/minnesotago/pdf/2013/MnDOTFinalReport.pdf.
10 Tom Nehil, “Minnesota’s bridges are in good shape — for now,” Minnpost. com, December 5, 2013, at http://www.minnpost.com/data/2013/12/minnesotas- bridgesare-good-shape-now.
11 “The Fix We’re in For: The State of Our Bridges: Minnesota Data,” Transportation for America, accessed November 10, 2014, http://t4america.org/ maps-tools/bridges/states//?state=mn.
12 Federal Highway Administration, U.S. Department of Transportation, Highway Statistics 2003, available at http://www.fhwa.dot.gov/policyinformation/statistics.cfm; and Federal Highway Administration, U.S. Department of Transportation, Highway Statistics 2012, available at http://www.fhwa.dot.gov/policyinformation/statistics.cfm.
13 Minnesota Department of Transportation, 2012 Annual Minnesota Transportation Performance Report (March 2014), available at http://www.dot.state. mn.us/measures/pdf/2012ReportBooklowrez4-15.pdf.
14 Adie Tomer et al., Missed Opportunity: Transit and Jobs in Metropolitan (Brookings Institution, May 12, 2011). Twin Cities data available at http://www. brookings.edu/~/media/Series/jobs%20and%20transit/MinneapolisMN.PDF.
15 Katherine Kersten, “The Met Council Will Burden You Now,” Star Tribune, April 14, 2014, available at http://www.americanexperiment.org/publications/ commentaries/themet-council-will-burden-you-now.
16 Kristina Peterson, “Highway Funding Faces Bumpy Road,” Wall Street Journal, May 8, 2014, available at http://online.wsj.com/news/articles/SB10001424052702304 655304579550252466238262.
17 Minnesota Department of Transportation, Minnesota State Highway Investment Plan: 2014-2033 (December 2013), available at http://www.dot.state.mn.us/planning/ mnship/.
18 Minnesota Transportation Advisory Committee, Minnesota Moving Ahead: Transportation Funding and Financing for the Next 20 Years (December 2012), available at http://www.dot.state.mn.us/tfac/docs/final-report.pdf. See also Steven Dornfeld, “With federal highway trust fund running on empty, Minnesota transportation advocates want action,” MinnPost.com, June 11, 2014, at http://www. minnpost.com/politics-policy/2014/06/federal-high-way-trust-fund-running-empty- minnesota-transportation-advocates-.
19 Minnesota Department of Transportation, Minnesota State Highway Investment Plan: 2014-2033 (December 2013), available at http://www.dot.state.mn.us/planning/ mnship/.
20 Press Release, Texas A&M Transportation Institute, “As Traffic Jams Worsen, Commuters Allowing Extra Time for Urgent Trips,” February 5, 2013, available at http://mobility.tamu.edu/ums/media-information/press-release/.
21 Id.
22 Texas A&M Transportation Institute, 2012 Urban Mobility Report, Table 2. What Congestion Means in Your Town, 2011 (December 2012), available at http:// d2dtl5nnlpfr0r.cloudfront.net/tti.tamu.edu/documents/ums/congestion-data/ national/national-table2.pdf.
23 Washington State Department of Transportation, The Impact of Truck Congestion on Washington State’s Economy (June 2012), available at http://www.wsdot.wa.gov/NR/rdonlyres/4D-53B6C5-D1DF-4A3C-9B67-FD90D4847A66/0/ June2012_Impact_Freight_Congestion.pdf.
24 Minnesota’s Gross State Product was 76.5 percent of Washington’s GSP in 2013. U.S. Bureau of Economic Analysis, Regional Economic Accounts: GDP and Personal Income, available at http://www.bea.gov/regional/index.htm.
25 Minnesota Department of Transportation, Guideway Status (November, 2013), available at http://www.dot.state.mn.us/govrel/ reports/2013/2013GuidewayStatusReport.pdf.
26 Id.
27 Id.
28 Smart Growth America, Smart Transportation: Save Money and Grow
the Economy – Minnesota Report (January 2011), available at http://www.smartgrowthamerica.org/documents/smart-transportation-minnesota.pdf.
29 Minnesota Management and Budget, Budget and Economic Forecast (February 2014), available at http://www.mmb.state.mn.us/doc/fu/14/complete.pdf.
30 Minnesota Office of the Legislative Auditor, Evaluation Report: State Highways and Bridges (February 19, 2008), available at http://www.auditor.leg.state.mn.us/ ped/2008/trunkhwy.htm.
31 “History,” Counties Transit Improvement Board, accessed November 10, 2014, http://www.mnrides.org/about-us/history.
32 Laurie Blake, “Dakota County starting to question its return on transit,” Star Tribune, July 5, 2014, available at http://www.startribune.com/local/265913841.html.
33 Mark Perlman and Julia Pulidindi, Public-Private Partnerships for Transportation Projects, (National League of Cities, 2012), available at http://www.nlc.org/documents/Find%20City%20Solutions/Research%20Innovation/Infrastructure/ public-private-partnerships-for-transportation-projects-mag-may12.pdf.
34 See “Minnesota Towards Zero Deaths,” Center for Transportation Studies, University of Minnesota, accessed November 10, 2014, http://www.minnesotatzd.org.