Minimum wage laws don’t boost wages, they just outlaw jobs
Last week I wrote about Minnesota’s labor supply curve. But that is only half the story. What about the demand side of the labor market?
How to derive a demand curve for labor
I would be quite happy to pay someone $1 a day to carry my briefcase around for me. at a push, maybe I’d pay $2 a day. But, for $3 a day, I’ll carry it myself, it isn’t so much of a hardship after all. As the amount I need to pay the briefcase carrier increases, so does the opportunity cost of hiring them. A bit of economics jargon, opportunity cost is the value of the next-highest-valued alternative use of that resource, in this case, the next most valuable thing I could spend that $3 on.*
For another example, imagine Aaron Rodgers was looking to supplement his income by hiring himself out for parties. At a price of $25 per appearance, both a Vikings fan and a Packers fan would be willing to book him, though for very different reasons. But, at $50 per appearance, the Packers fan might still book him. The Vikings fan, by contrast, might think “I don’t want to blow raspberries at the guy that much” and spend his $50 on something else.
What we’ve done in both cases is to derive a demand curve. In the first instance for briefcase carriers and in the second for Aaron Rodgers jumping out of a birthday cake. We can show this with a graph like Figure 1 below. In both cases, as the price increases the quantity demanded decreases.**
Figure 1 – Demand curve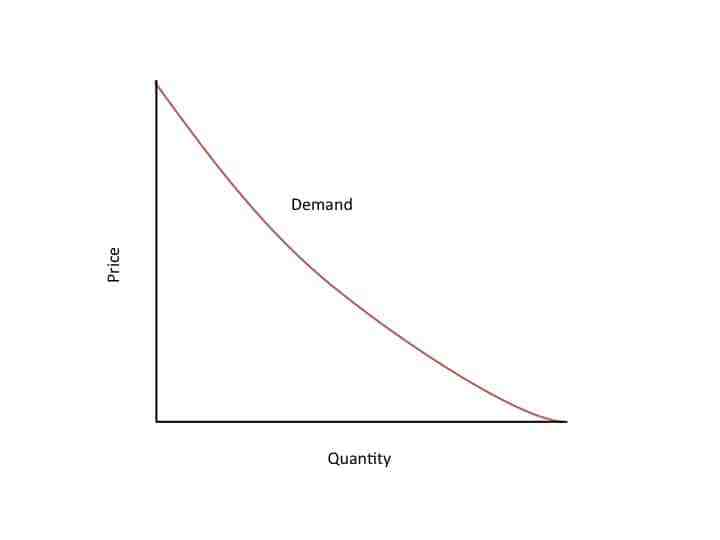
Downward sloping demand curves mean minimum wage laws are bad
Demand curves slope downwards. So what? Well, if you support minimum wage laws, so quite a lot.
A minimum wage law outlaws any hiring below a certain wage rate. In effect, it amputates the section of the labor demand and supply curves below that rate. Figure 2 illustrates this. At a wage rate of W0, L0 of labor is both supplied and demanded. If the law mandates a wage of W1, the quantity of labor supplied rises to L1 but the quantity of labor demanded falls to L2, with unemployment the result.
Figure 2 – The effects of minimum wage laws
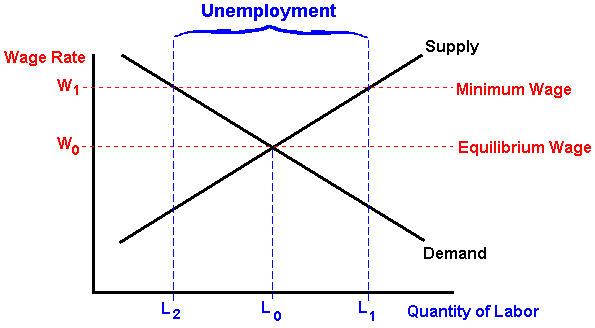
If, in the case of briefcase carriers, the minimum wage is set at $3, I won’t hire a briefcase carrier. As the economists Paul Krugman and Robin Wells put it, “when the minimum wage is above the equilibrium wage rate, some people who are willing to work – that is, sell labor – cannot find buyers – that is, employers –willing to give them jobs.”
Frequently, supporters of higher minimum wages implicitly embrace this logic. If you say “Why stop at $15? Why not $100?” they will often reply “That is crazy”. Indeed it is, and it is crazy because the demand curve slopes downwards and hiking the minimum wage to $100 will destroy most jobs. But, if the demand curve slopes downwards between a wage rate of $100 and $15, why does it it not continue sloping downwards at wage rates below that? It does, of course, and that means jobs losses.
Coming soon…
This is all theory but it bears out in practice. Tomorrow we’ll look at a real world example of these forces in action and at how the model applies to Minnesota’s labor market.
* Opportunity cost doesn’t have to be a monetary value. The opportunity cost of going to a Twins game might be going to a Wild game or painting the house.
**For economics students, one of the most common mistakes is to mix up a change in quantity demanded and a change in demand. The first is a move along a demand curve, the second is a movement of the demand curve itself. Few people ever need to worry about the difference.
John Phelan is an economist at Center of the American Experiment.