Minnesota’s cities are seeing falling employment and rising unemployment numbers
On Tuesday and Thursday this week I’ve written about emerging problems in Minnesota’s labor market. Over the last year, we have led other states on population growth and unemployment growth, but lagged them on job growth. In short, our state’s below average job growth is not keeping pace with its above average population growth.
But what is the detail behind the statewide aggregates? Using data from Minnesota’s Department of Employment and Economic Development, we can look at
Figure 1 shows how employment – that is the number of people employed – has changed between June 2018 and June 2019. We see that in only one of Minnesota’s MSAs has the number of people employed actually risen over that period – the 2.5% increase in Rochester. In the other four MSAs, the number of people employed fell over that period – by 0.4% in St. Cloud, 0.6% in the Twin Cities, and by 1.2% in both Duluth and Mankato.
Figure 1: Employment growth in Minnesota’s Metropolitan Statistical Areas, June 2018-June 2019 (June 2018 = 100)
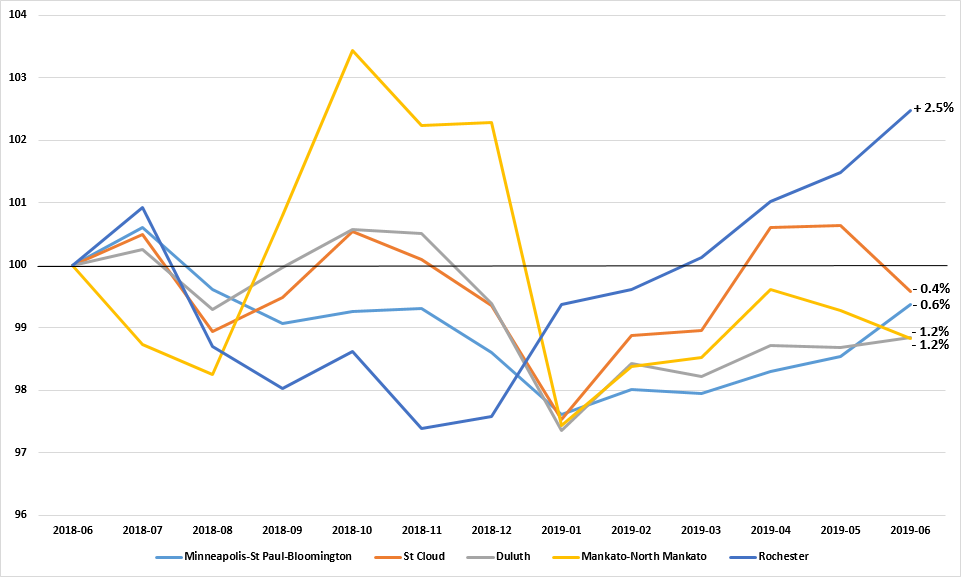
Source: Minnesota Department of Employment and Economic Development
Figure 2 shows how unemployment – that is the number of people unemployed – has changed between June 2018 and June 2019. We see that in every one of Minnesota’s MSAs the number of people unemployed has risen over the period. Rochester lead the way with an increase in the number of people unemployed of 19.7%, followed by Mankato (18.3%), the Twin Cities (15.8%), St. Cloud (13.3%), and Duluth (6.7%).
Figure 2: Unemployment growth in Minnesota’s Metropolitan Statistical Areas, June 2018-June 2019 (June 2018 = 100)
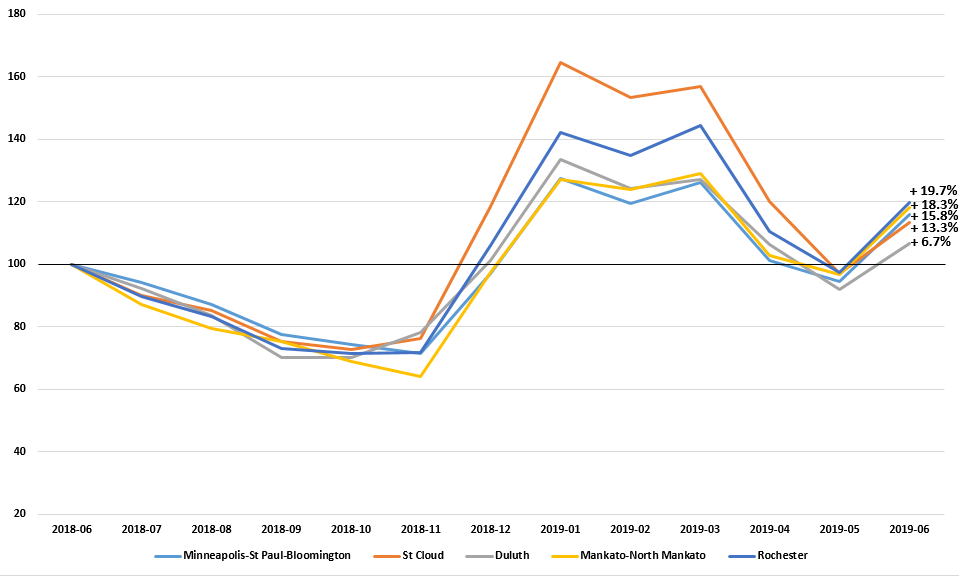
Source: Minnesota Department of Employment and Economic Development
Taken together, those people who are employed and those who are unemployed but looking for work make up the labor force. This means that if the number of unemployed workers rose while the number of those employed remained constant, for example, the labor force would show as growing.
So, in Rochester, over this period, the number of employed has risen by 2,980 and the number of unemployed by 622. Its labor force growth has been 3,602, 17% of which has been made up by the increase in unemployed workers. In each of the other four Minnesota MSAs, however, the declines in employment have been greater than the rises in unemployment so the overall labor force has shrunk, as Figure 3 shows.
Figure 3: Change in employment, unemployment, and labot force, June 2018-June 2019
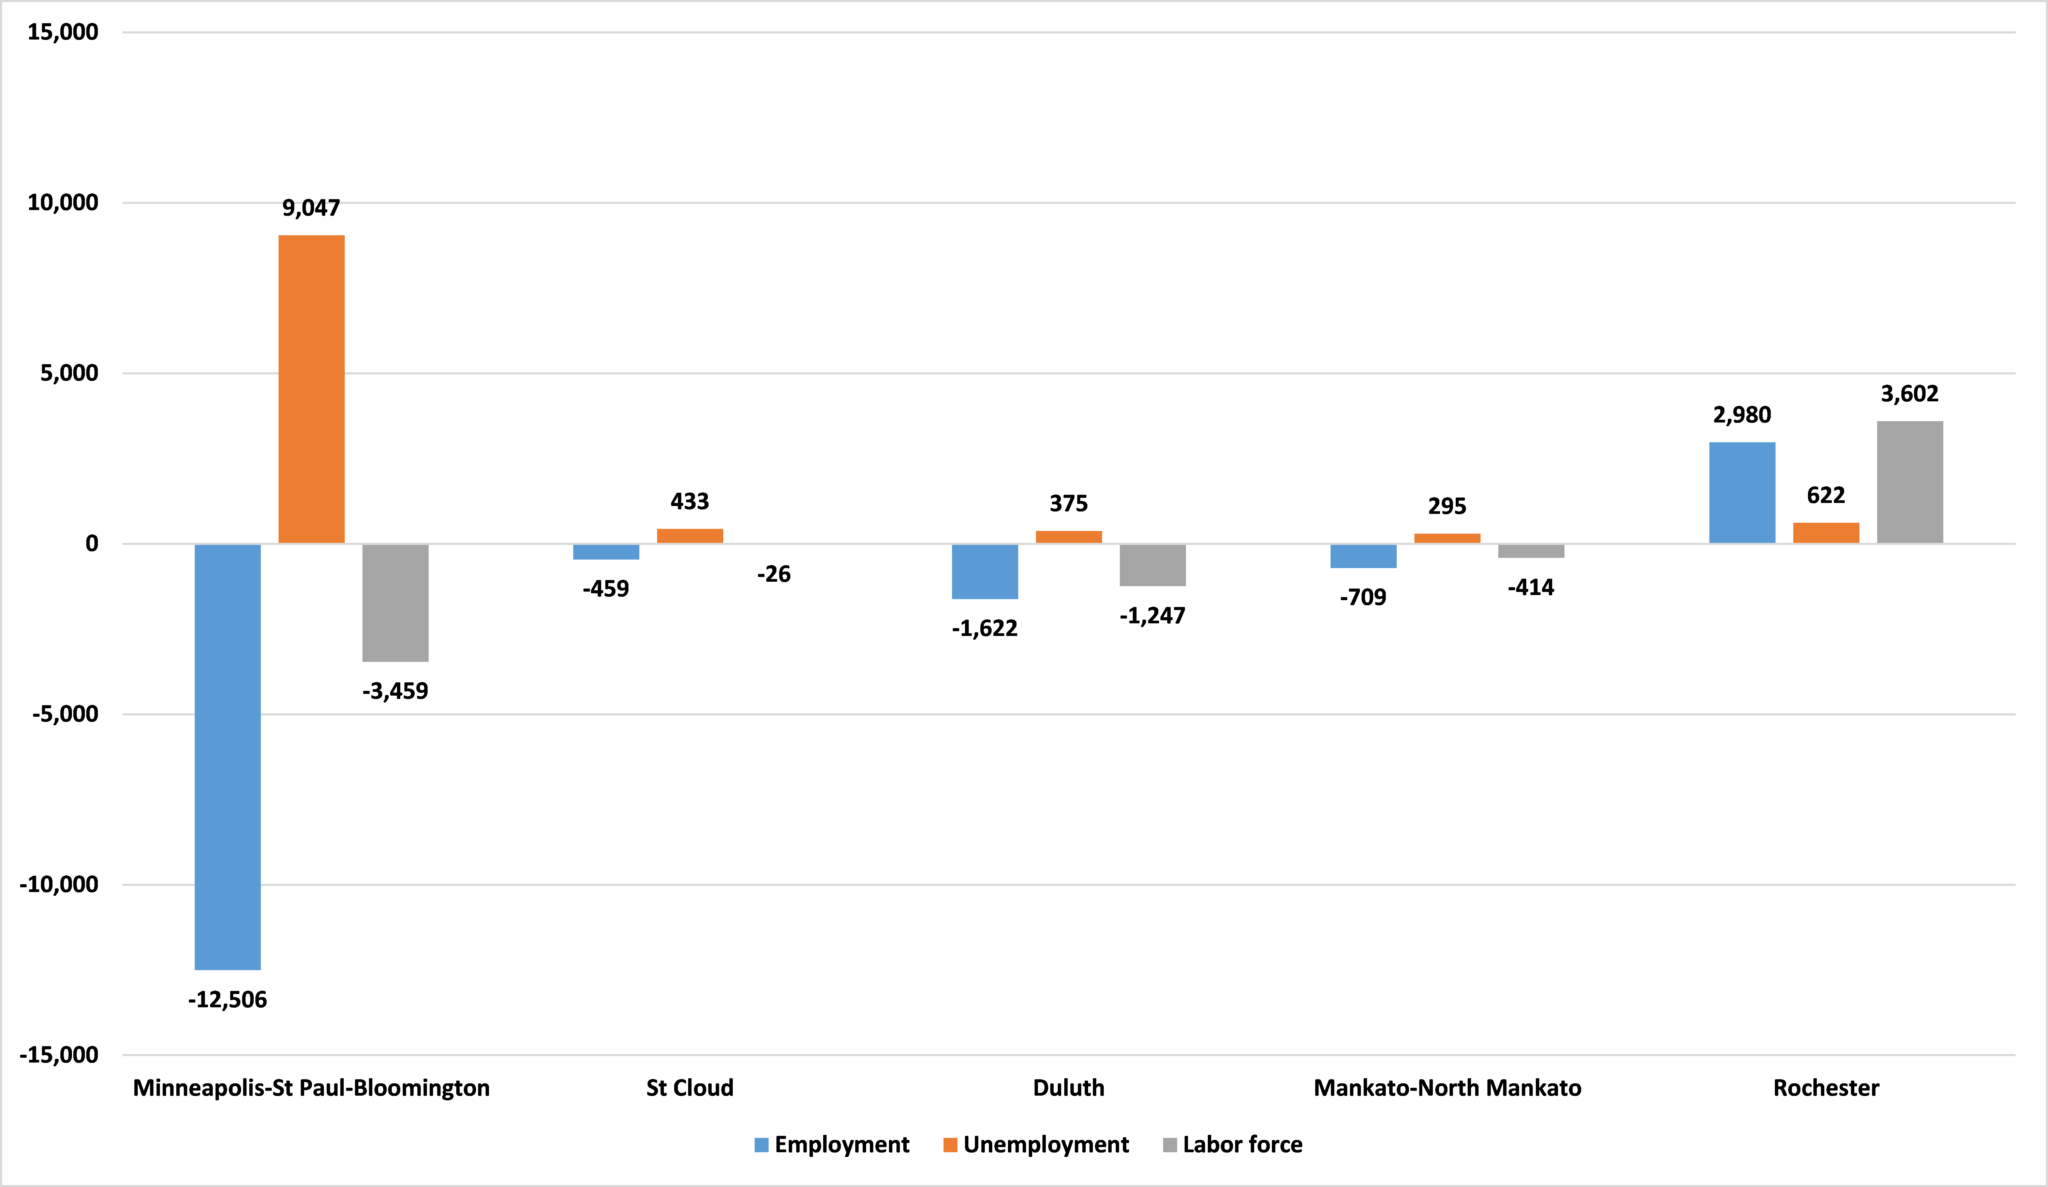
Source: Minnesota Department of Employment and Economic Development
John Phelan is an economist at the Center of the American Experiment.