Minnesota’s falling unemployment rate is still entirely due to Minnesotans leaving the labor force
Minnesota’s June unemployment rate of 1.8% prompted some celebration in our state’s media. Fox 9 trumpeted:
Minnesota’s 1.8% unemployment rate in June was the lowest ever recorded by a state over a half-century of recordkeeping.
Isn’t this great news?
As I’ve noted before, the Bureau of Labor Statistics (BLS):
…divides Minnesota’s population up into those in the labor force and those who are not. Those Minnesotans who are either employed or unemployed but looking for work are deemed to be in the labor force.
In November, I explained that:
The unemployment rate is calculated by dividing the number of people who are unemployed but looking for work by the total number of people in the labor force. Crucially, people who are unemployed and not looking for work are not counted in the labor force. Because of this, it is possible for the unemployment rate to fall without the number of people employed rising if people simply give up looking for work. So, to properly assess the employment situation in Minnesota we need to look at three things: changes in the number of people unemployed, changes in the number of people employed, and changes in the number of people not in the labor force at all.
So, lets take a look.
Unemployed
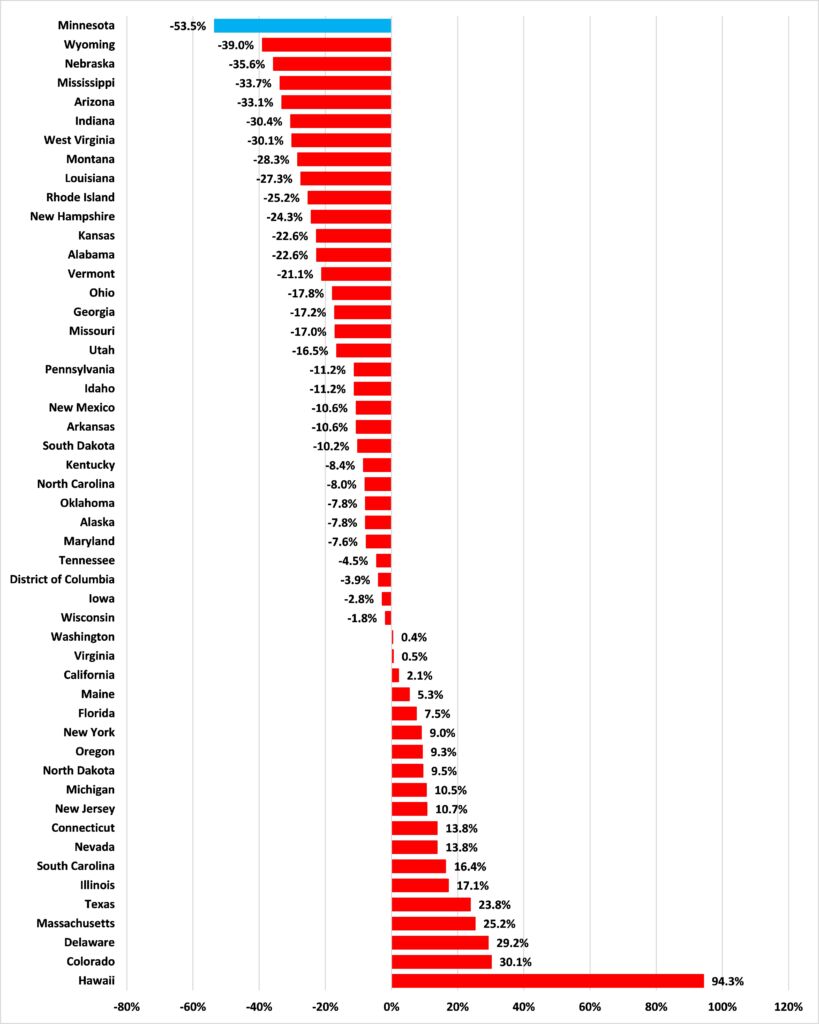
BLS numbers show that Minnesota is actually one of 32 states with fewer people unemployed in June 2022 than were unemployed in the pre-pandemic peak in February 2020, as Figure 1 illustrates. Indeed, over this period we have seen the steepest percentage fall in the United States in the number of people unemployed. This would seem to be good news.
Figure 1: Change in total unemployment, February 2020 to June 2022
Employed
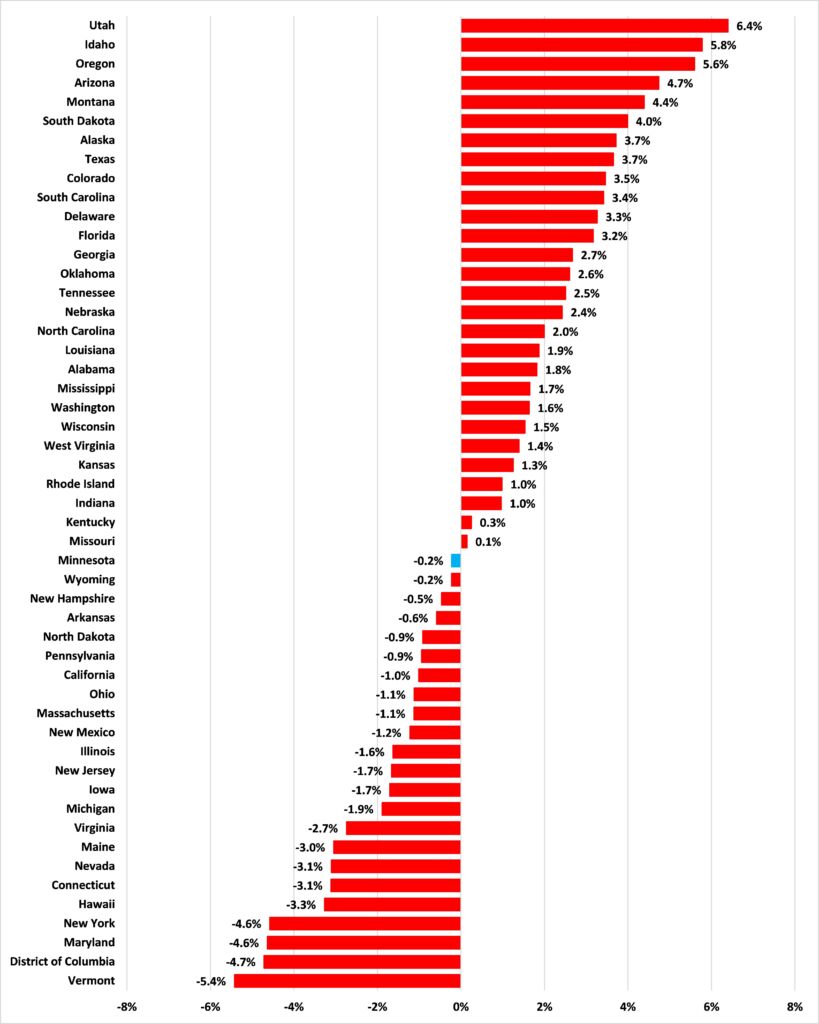
But this decline in total unemployment is not the result of increased employment. Indeed, as Figure 2 shows, Minnesota had 1.5 percent fewer people employed in March 2022 than it did in February 2020. Ours was one of 27 jurisdictions that had fewer people employed now than before COVID-19 hit.
Figure 2: Change in total employment, February 2020 to June 2022
Out of the labor force
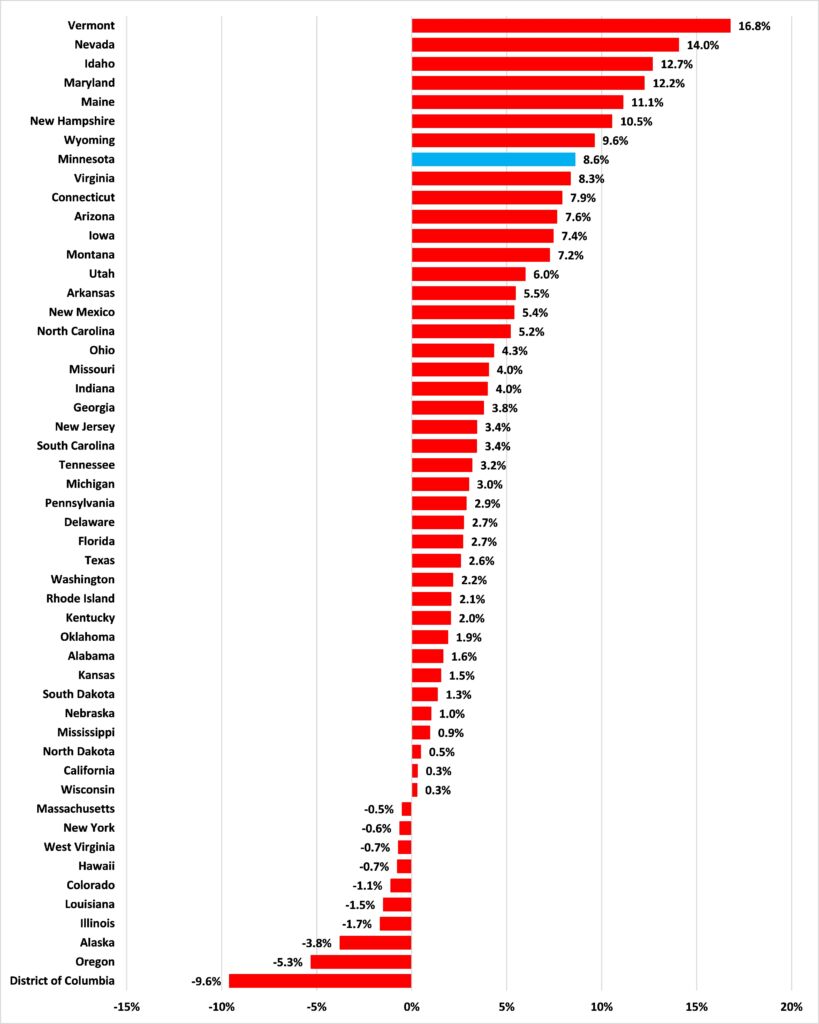
So, to account for a fall in the number of people both unemployed and employed we have to look at the number of people who have left the labor force completely. We can calculate this by subtracting the number of people in the labor force from the number for the civilian non-institutional population.
Figure 3 shows that the number of people who are not in Minnesota’s labor force has increased by 8.6 percent between February 2020 and June 2022: this is the 8th largest increase in the United States. This would seem to be bad news.
Figure 3: Change in total not in the labor force, February 2020 to March 2022
As I wrote in April when I made this point previously:
The next time a politician or anyone in the media remarks on Minnesota’s low unemployment rate, remember the numbers behind it.