Minnesota’s fastest-growing counties border the Dakotas
Today, the Bureau of Economic Analysis released data for Gross Domestic Product (GDP) for Minnesota’s counties for 2020. We now have this data going back to 2001, so we can look at the picture for economic growth within our state since the turn of the 21st century.
Lets start with real GDP growth, that is adjusted for inflation. Between 2001 and 2020, Minnesota’s GDP grew by 31.9 percent. Thirty-five of the state’s counties saw their GDP grow faster than that and 52 saw it grow more slowly.
Figure 1 shows in more detail how GDP growth has varied across the state this century. In five counties (Mahnomen, Lake, Norman, Koochiching, and Cook) GDP has actually fallen since 2001. In another two (Traverse and Pennington), by contrast, GDP has more than doubled — in Pennington County, real GDP has increased by a staggering 171.9 percent since 2001.
Figure 1: Real GDP growth, 2001 to 2020
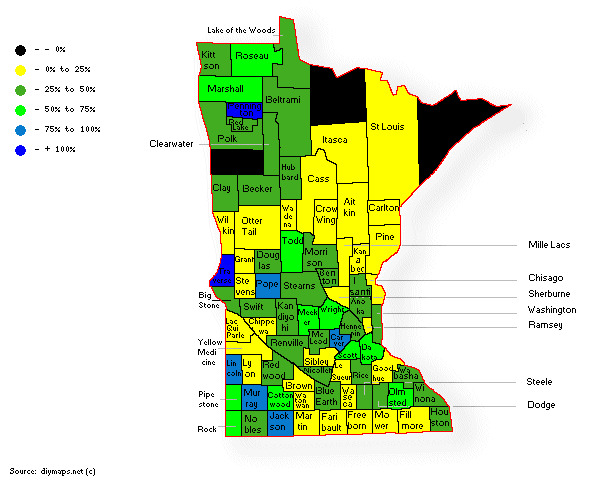
Source: Bureau of Economic Analysis
These fastest growing counties are also among the smaller counties in terms of GDP (in 2020, Traverse and Pennington together accounted for just 0.6 percent of state GDP). As a result, their contribution to state GDP growth is modest. Indeed, as Figure 2 shows, just three Minnesota counties (Hennepin, Dakota, and Ramsey) accounted for 53.7 percent of all the state’s GDP growth between 2001 and 2020.
Figure 2: County’s share of Minnesota’s real GDP growth, 2001 to 2020
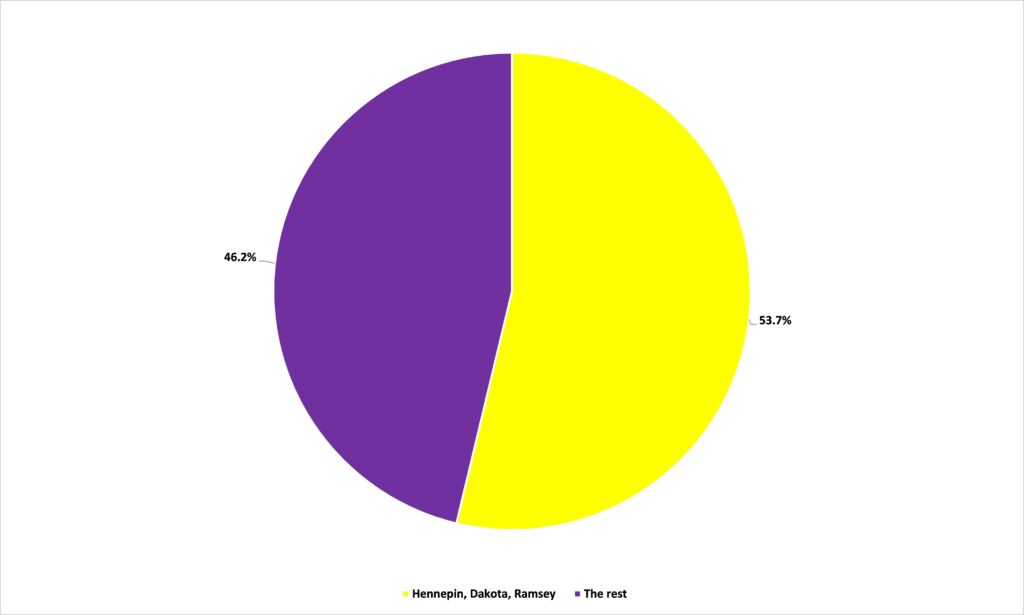
Source: Bureau of Economic Analysis
The contribution to state GDP growth of these three counties is disproportionate to their contribution to state population growth over the period 2001 to 2020, 40.3 percent. Ceteris paribus, you would expect to see total GDP grow as a population expands because there are more people available to produce the goods and services that make up GDP. When total GDP expands at a rate greater than the population — as in these three counties — it means that per capita GDP is growing, and that is what matters for living standards.
We ought to be wary of talking too much about GDP at the county level. While people generally spend much of their time in a particular country or even state, they are vastly more mobile across county borders. If someone lives in Dakota County but works in Hennepin County, where should their GDP be allocated? It might be produced in Hennepin County, but it is consumed — largely — in Dakota, and GDP is intended to measure wellbeing.
Even so, it is worth noting that the Minnesota county with the greatest increase in GDP so far this century (Pennington County) saw its population edge up by only 3.7 percent over the same period. In per capita GDP terms, then, it was also the state’s star performer, with real per capita GDP growth of 162.1 percent. And, while the other four counties that saw real per capita GDP growth of more than 100 percent (Jackson, 104.2 percent; Murray, 107.4; Lincoln, 119.8; and Traverse, 147.8) saw falls in their populations of at least 10 percent (10.8 percent; 10.5; 12.1; and 19.1 respectively), they were also among the top five counties for total GDP growth (82.1 percent; 85.7; 93.2; and 100.5 respectively). In other words, per capita GDP growth in these counties was down to strong total GDP growth more than shrinking populations.
We can, perhaps, shed some more light on this by looking at a geographical area intermediate to the state and the county. The Minnesota Department of Employment and Economic Development (DEED) groups the counties into Economic Development Regions (EDR), shown in Figure 3.
Figure 3: Economic Development Regions
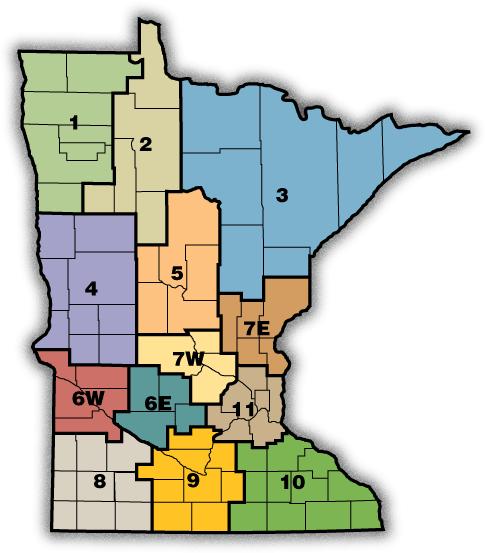
Source: Minnesota Department of Employment and Economic Development
Table 1 summarizes the data on real GDP and population changes for these EDRs for the period 2001 to 2020. We can see that while the 7 County Twin Cities EDR 11 accounted for 69.1 percent of Minnesota’s real GDP growth from 2001 to 2020, its rate of growth ranked sixth out of thirteen. The strongest performer was the Northwest EDR 1, home to Pennington County. While it accounted for just 1.5 percent of Minnesota’s GDP in 2020, it was responsible for 2.6 percent of the state’s GDP growth over the period 2001 to 2020. The Arrowhead EDR 3, by contrast, accounted for 4.2 percent of our state’s GDP in 2020 but was responsible for just 0.6 percent of its real GDP growth since 2001.
Table 1: Economic and population growth in Minnesota’s EDRs, 2001 to 2020
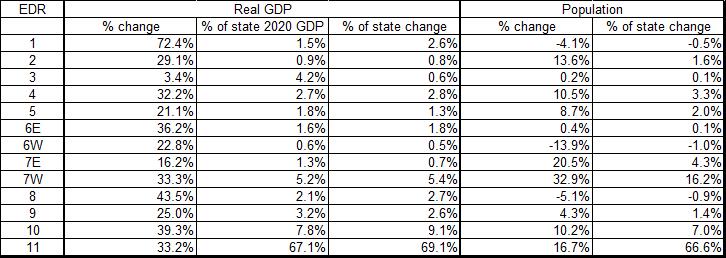
Source: Center of the American Experiment
This performance by the Northwest EDR 3 is all the more notable given that its population fell over the period. As we stated earlier, a growing population should drive a rise in GDP so a shrinking one should drive a fall. The performance of Northwest EDR 3 — especially contrasted with Arrowhead EDR 3, home to two counties where GDP fell, where the population edged up, but GDP growth was the lowest of our region — shows that a falling population can coexist with continued total GDP growth, not just per capita GDP growth.
A final point to note is that in both total and per capita terms, the five best performing counties for real GDP growth were all in either Northwest EDR 1 (Pennington), West Central EDR 4 (Traverse), or Southwest EDR 8 (Jackson, Lincoln, and Murray). In other words, the strongest GDP growth — the only counties scoring increases of 80 percent and up on either total of per capita terms — was found in EDRs bordering the Dakotas. Perhaps there is something more to that.