Minnesota’s minimum wage laws are harming youth employment
In December 2013, Minnesota’s State Demographic Center released a report titled ‘In the shadow of the Boomers: Minnesota’s labor force outlook‘. As we note in our new report, Minnesota’s Workforce to 2050, This report forecast that the state’s Labor Force Participation rate would decline to 64.6% in 2035 – it was 69.7% in 2018- as shown in Figure 1.
Figure 1: Minnesota’s Labor Force Participation rate, 1976-2050
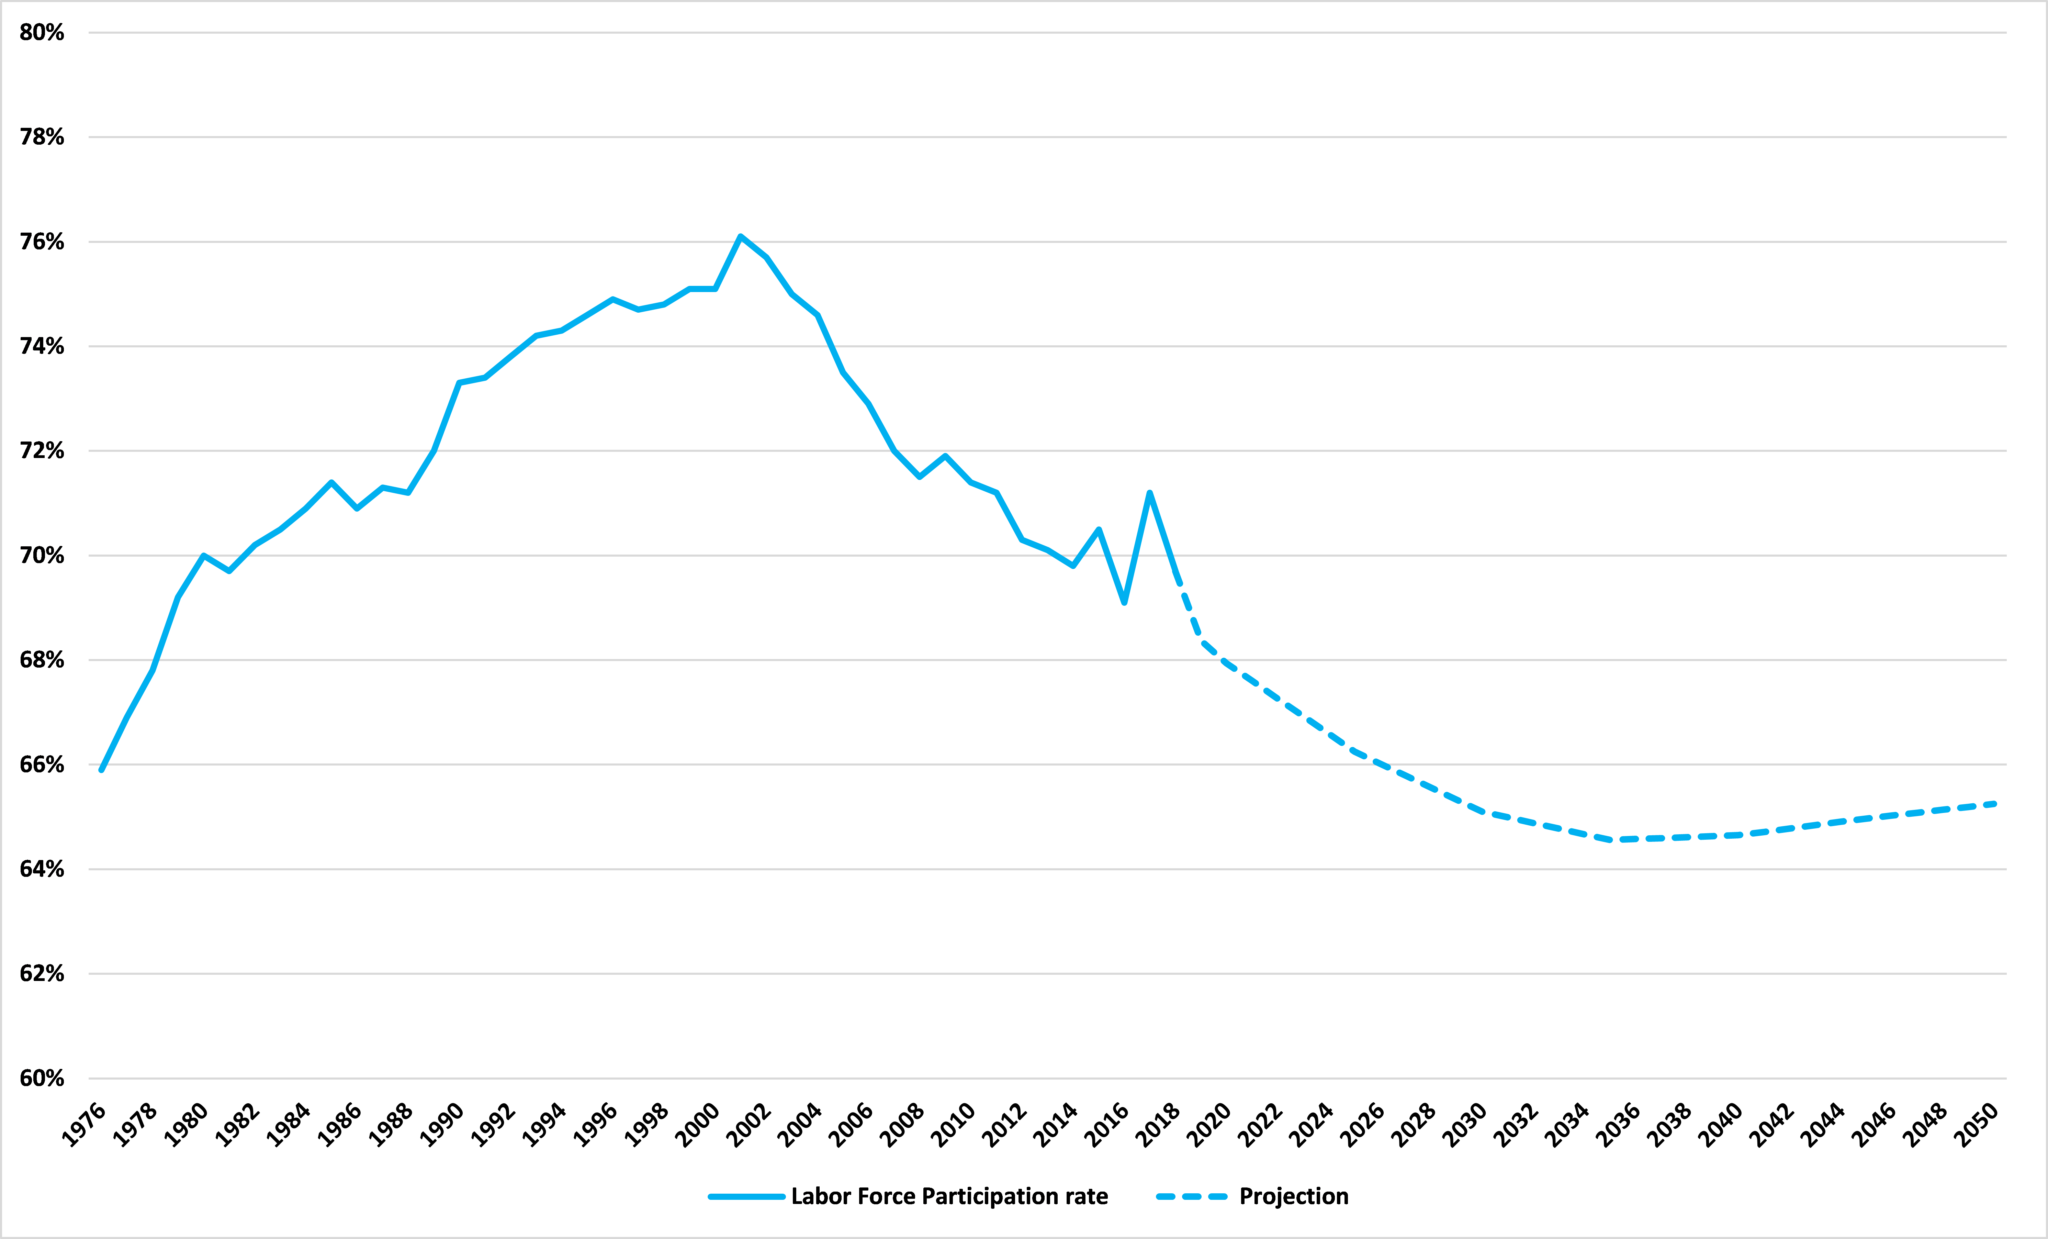
Source: Bureau of Labor Statistics and Minnesota State Demographic Center
As the title suggests, the report said that this would be driven primarily by the retirement of ‘Baby Boomers’. Indeed, there is much truth in this. But it is not the whole story. The Demographic Center’s own numbers show that, between 2020 and 2050, the participation rate will increase for every age group over 60. Indeed, as shown in Figure 2, the two biggest percentage point increases in the participation rate will be seen among Minnesotans aged 65-69 and 62-64.
Where we see the steepest percentage point declines in the participation rate is at the younger end of the scale. In every age category from 16 to 24, the participation rate is set to fall until 2050. Indeed, the three biggest percentage point declines in the participation rate are to be found in the three youngest categories.
Figure 2: Change in Minnesota’s Labor Force Participation rates, 2020-2050, percentage points
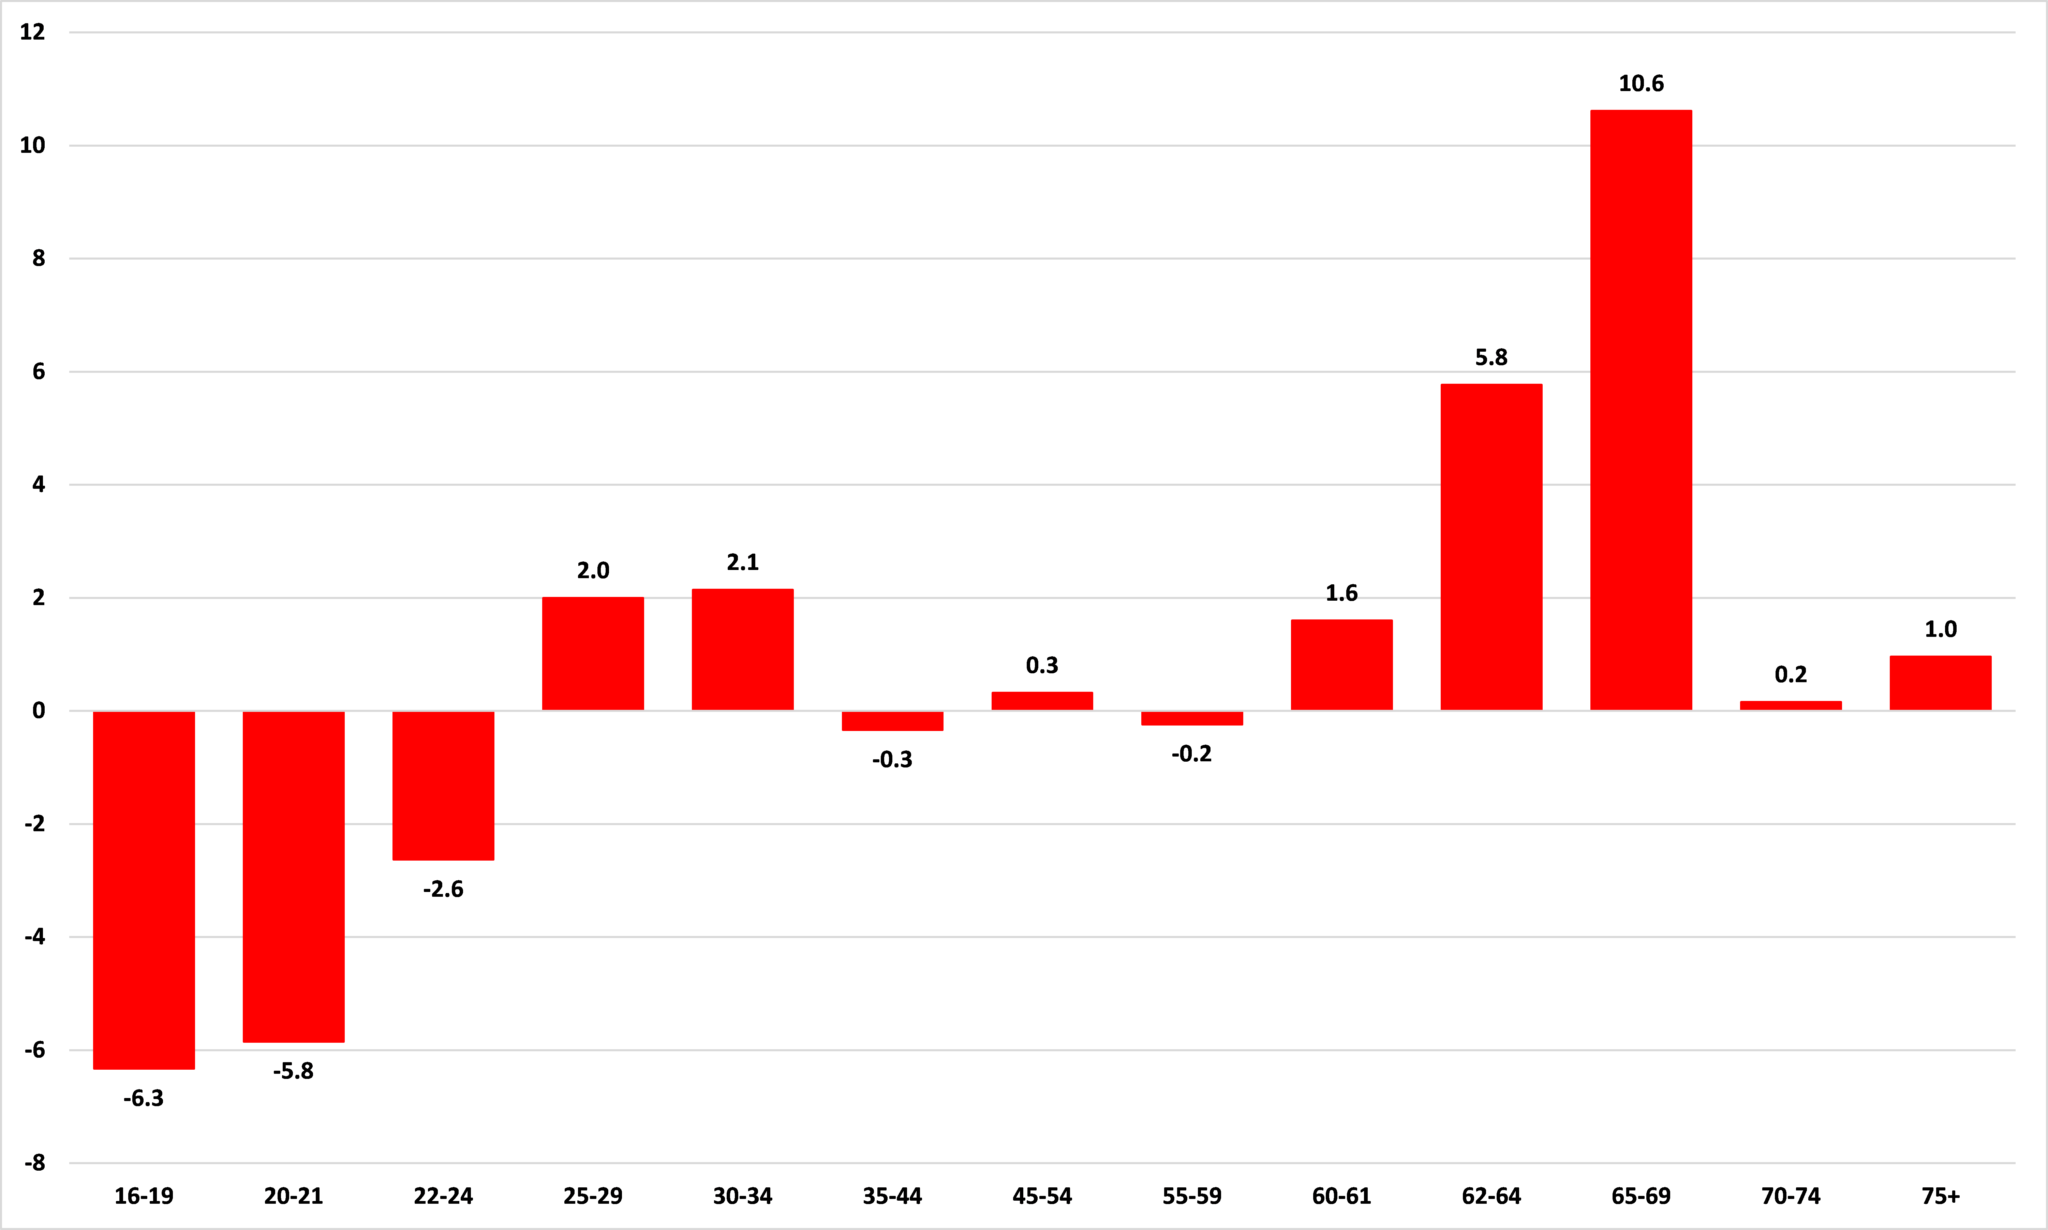
Source: Minnesota State Demographic Center
These forecasts seem reasonable enough given recent trends. Figure 3 shows categories where employment ratios have increased in Minnesota between 2000 and 2018. They include all workers, male and female, over the age of 55, and for women aged 25 to 34 and men aged 45 to 54. Compared with the same categories nationwide, Minnesota performed particularly well in the 55 to 64 category but less well among those over 65.
Figure 3: Percentage point changes in employment ratios, 2000-2018

Source: Bureau of Labor Statistics
Figure 4 shows the categories where employment ratios decreased in Minnesota between 2000 and 2018. We see that, overall, the steepest falls in employment ratios have been among younger Minnesotans. The largest decline has been among those aged 16 to 19 years. The next two largest falls are found among male and female Minnesotans, aged 20 to 24. The story is broadly similar nationally, with the larger declines being found among younger workers, especially young men. But Minnesota has underperformed the national average by some margin in some of these categories, particularly in the 20 to 24 category. On youth employment, this century Minnesota has performed poorly compared to the U.S. generally.
Figure 4: Percentage point changes in employment ratios, 2000-2018

Source: Bureau of Labor Statistics
What has driven this relatively poor performance on youth employment? In a recent paper titled ‘Explaining the Decline in the U.S. Employment-to-Population Ratio: a Review of the Evidence‘, economists Katharine Abraham and Melissa Kearney list higher minimum wages as one of the ‘Factors Contributing to Decline in Employment-Population Ratio between 1999 and 2018. Another recent review of the literature, by economist Jeffrey Clemens, echoes that. They note that higher minimum wages hit the employment of teenagers particularly hard. This makes sense. After all, a minimum wage simply makes it illegal to hire someone whose output the employer judges would be insufficient to cover the minimum wage. If, for example, a worker would add $10 an hour to an employer’s revenues but would cost $15 an hour to hire, that employer would be losing $5 an hour on the hire. If they want to stay in business, they won’t do that.
I’ve written before about the factors which go into this judgement:
These include an estimate of the worker’s skill and the tools the employee has to work with. Low skilled workers in labor intensive industries will tend to be low paid. Lacking the skills to generate much value, they also lack the capital inputs which would enable them to amplify what skills they do have. Other factors include the employer’s own estimate of how well they can utilize these inputs and of what demand for the output will be.
Generally, younger workers will be less skilled. They have not had the experience or the education necessary to accumulate skills. So, minimum wage laws which exclude low skilled workers from the labor market can be expected to have a disproportionate impact on younger workers.
Figure 5 shows the federal minimum wage and Minnesota’s minimum wage since 2000. Until 2005, they were the same. From then until 2008, Minnesota’s minimum wage was above the federal level. Between 2009 and 2013, the federal minimum wage was above Minnesota’s so the federal rate was binding here. Starting in 2013, however, Minnesota’s state government has hiked the minimum wage so that in 2018 it was 23.6% higher in real terms than it was in 2013.
Figure 5: Minimum wage rates in Minnesota and the United States (2018 dollars)
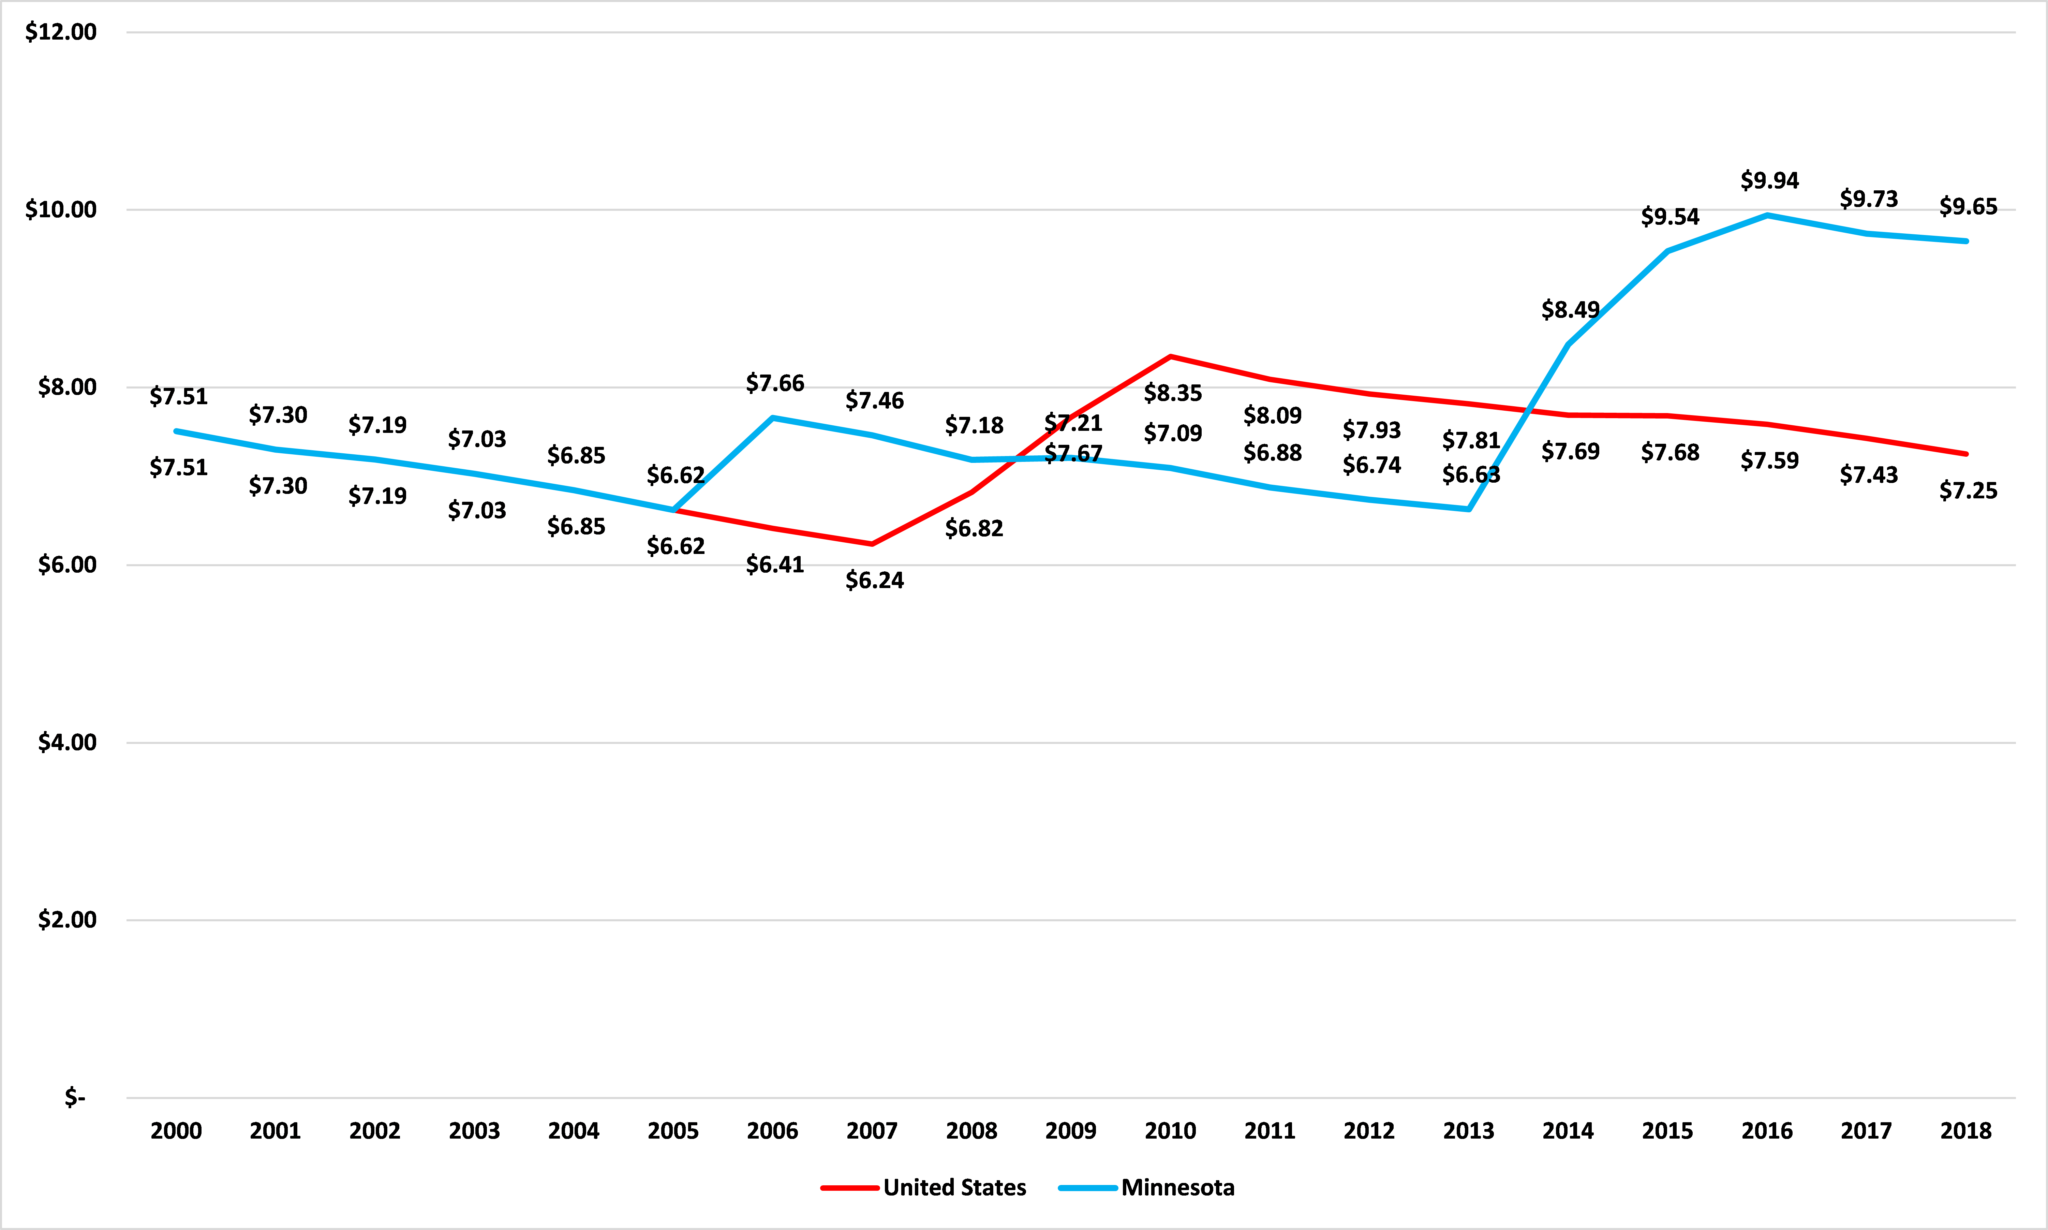
Source: Department of Labor
Taking these three things together; that Minnesota’s youth employment ratio has declined more than the national rate since 2000, that minimum wages have been found to disproportionately impact youth employment, and that our minimum wage has been especially high in recent years, we have to conclude that our state’s minimum wage laws are not good for our youth employment prospects. This is not good for those young workers, and will exacerbate Minnesota’s looming labor force decline.
John Phelan is an economist at the Center of the American Experiment.